
Overview
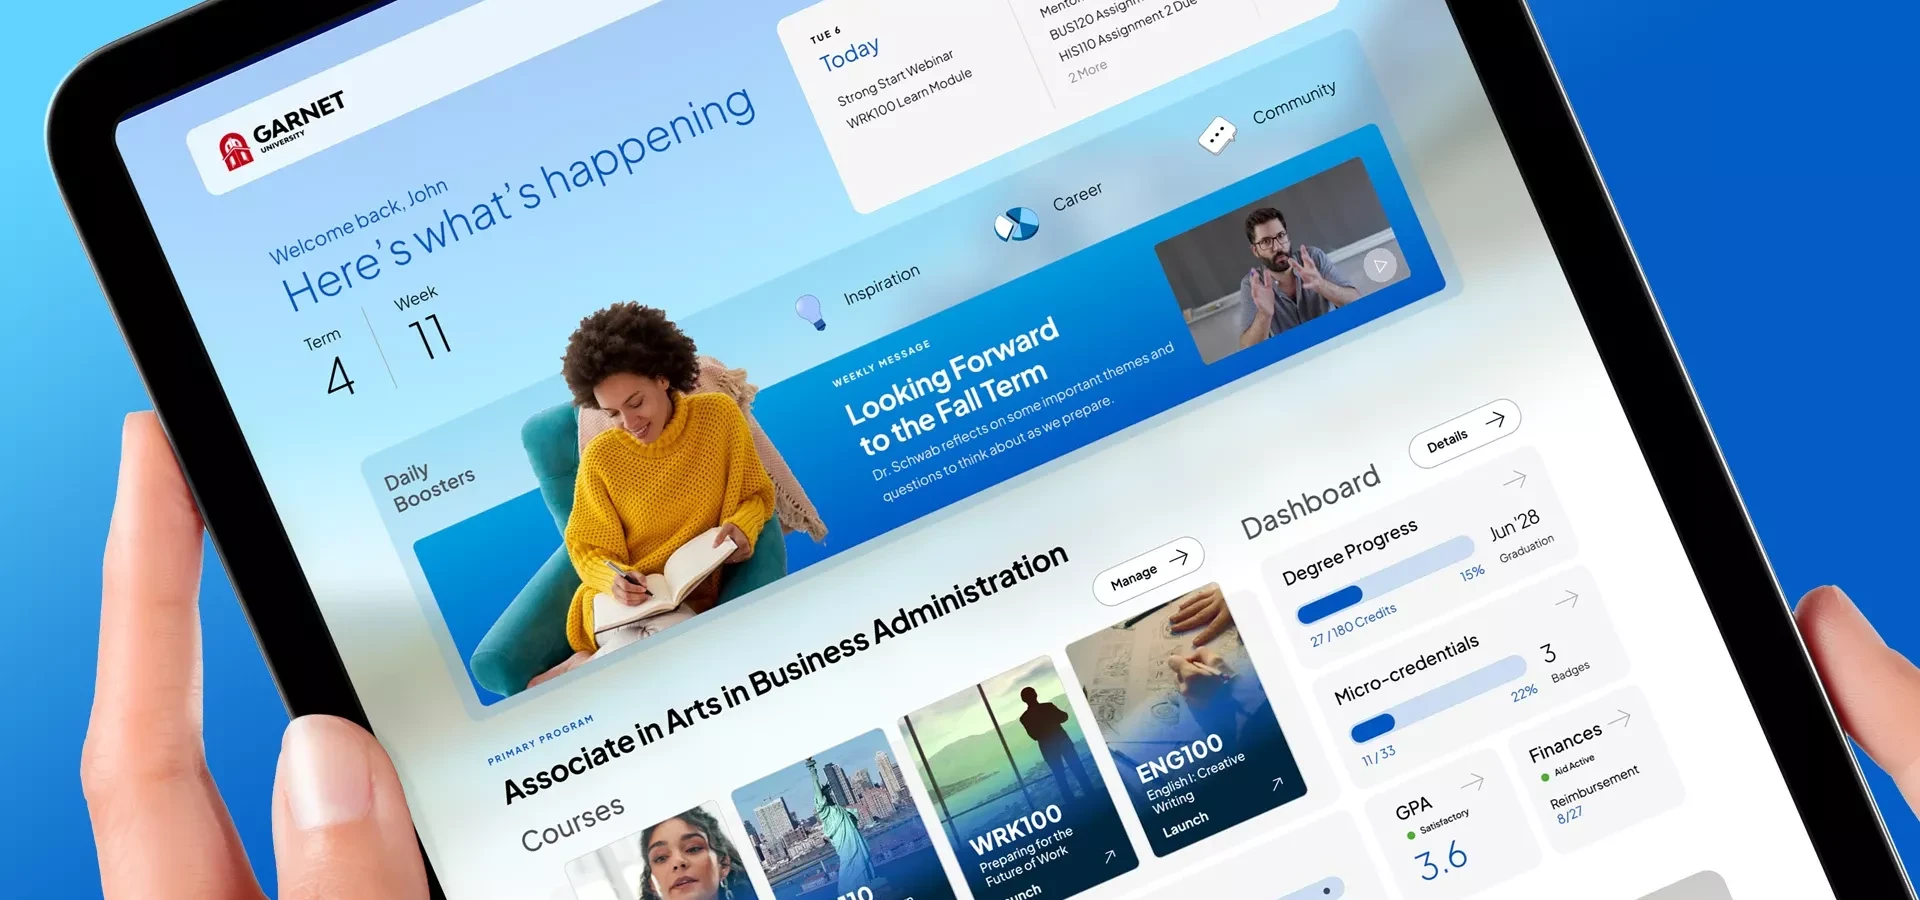
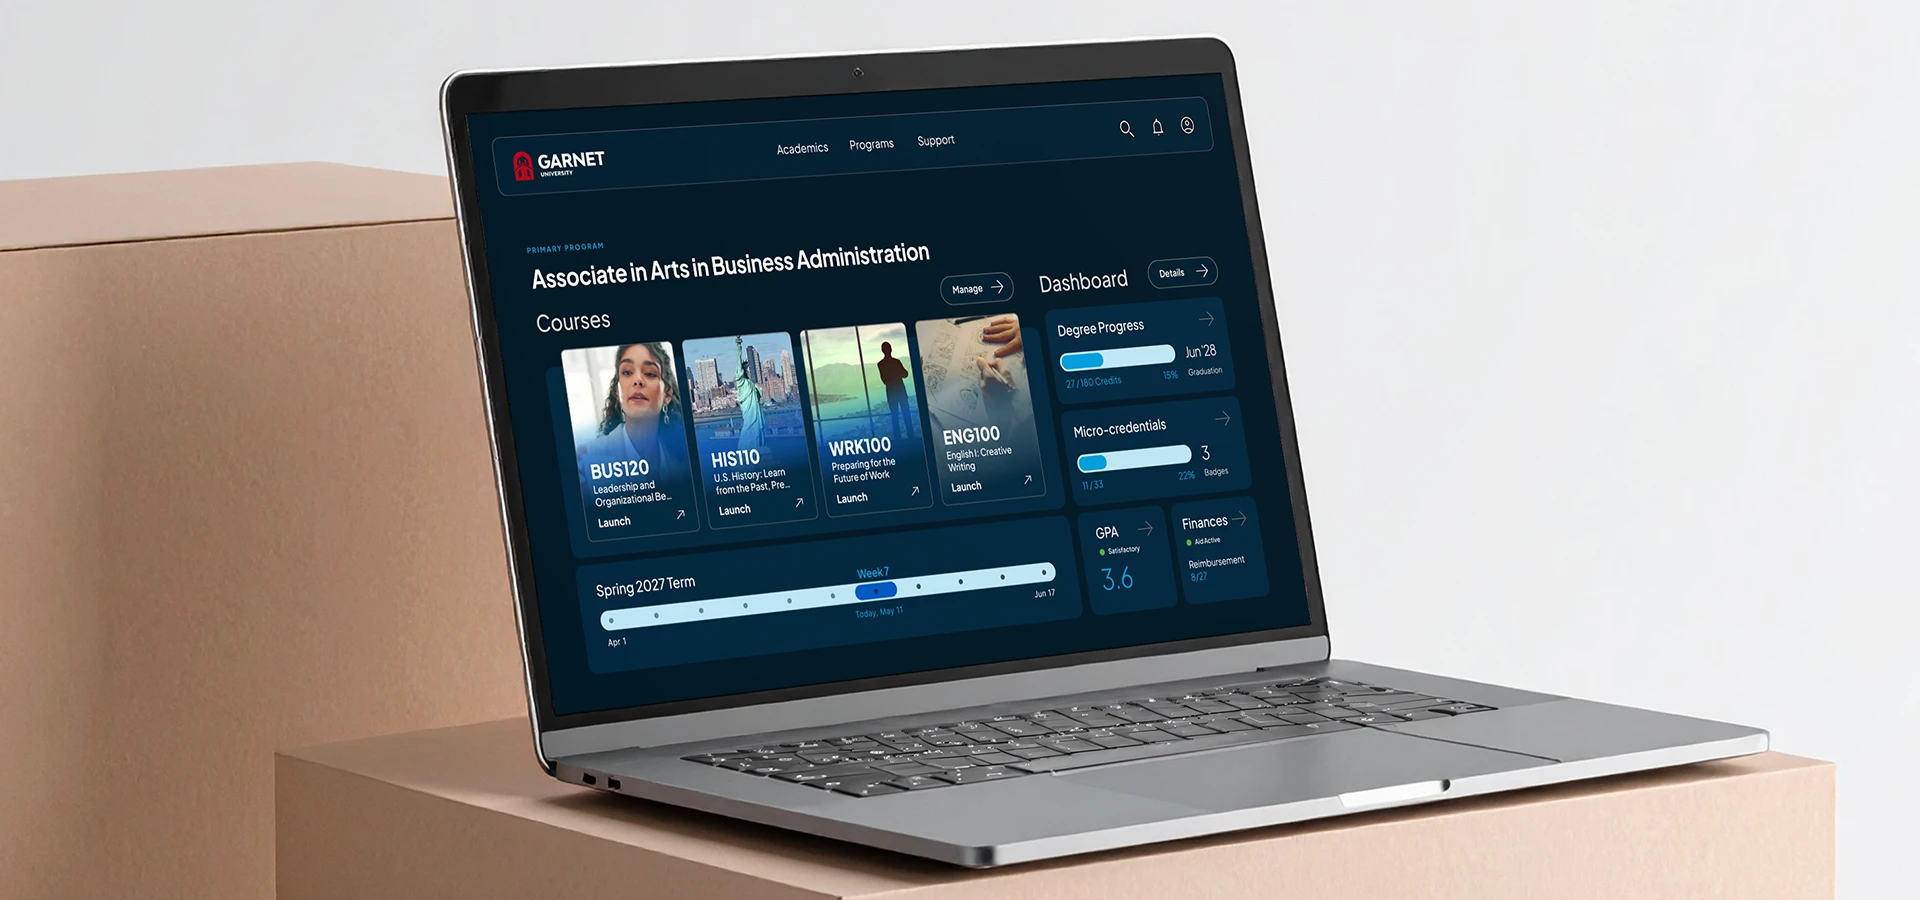
Before changing a pixel, I met with stakeholders, designers, and interviewed students to see what they disliked about the product and what they wanted to see added. This discovery phase resulted in dividing the project’s main goals into six categories.
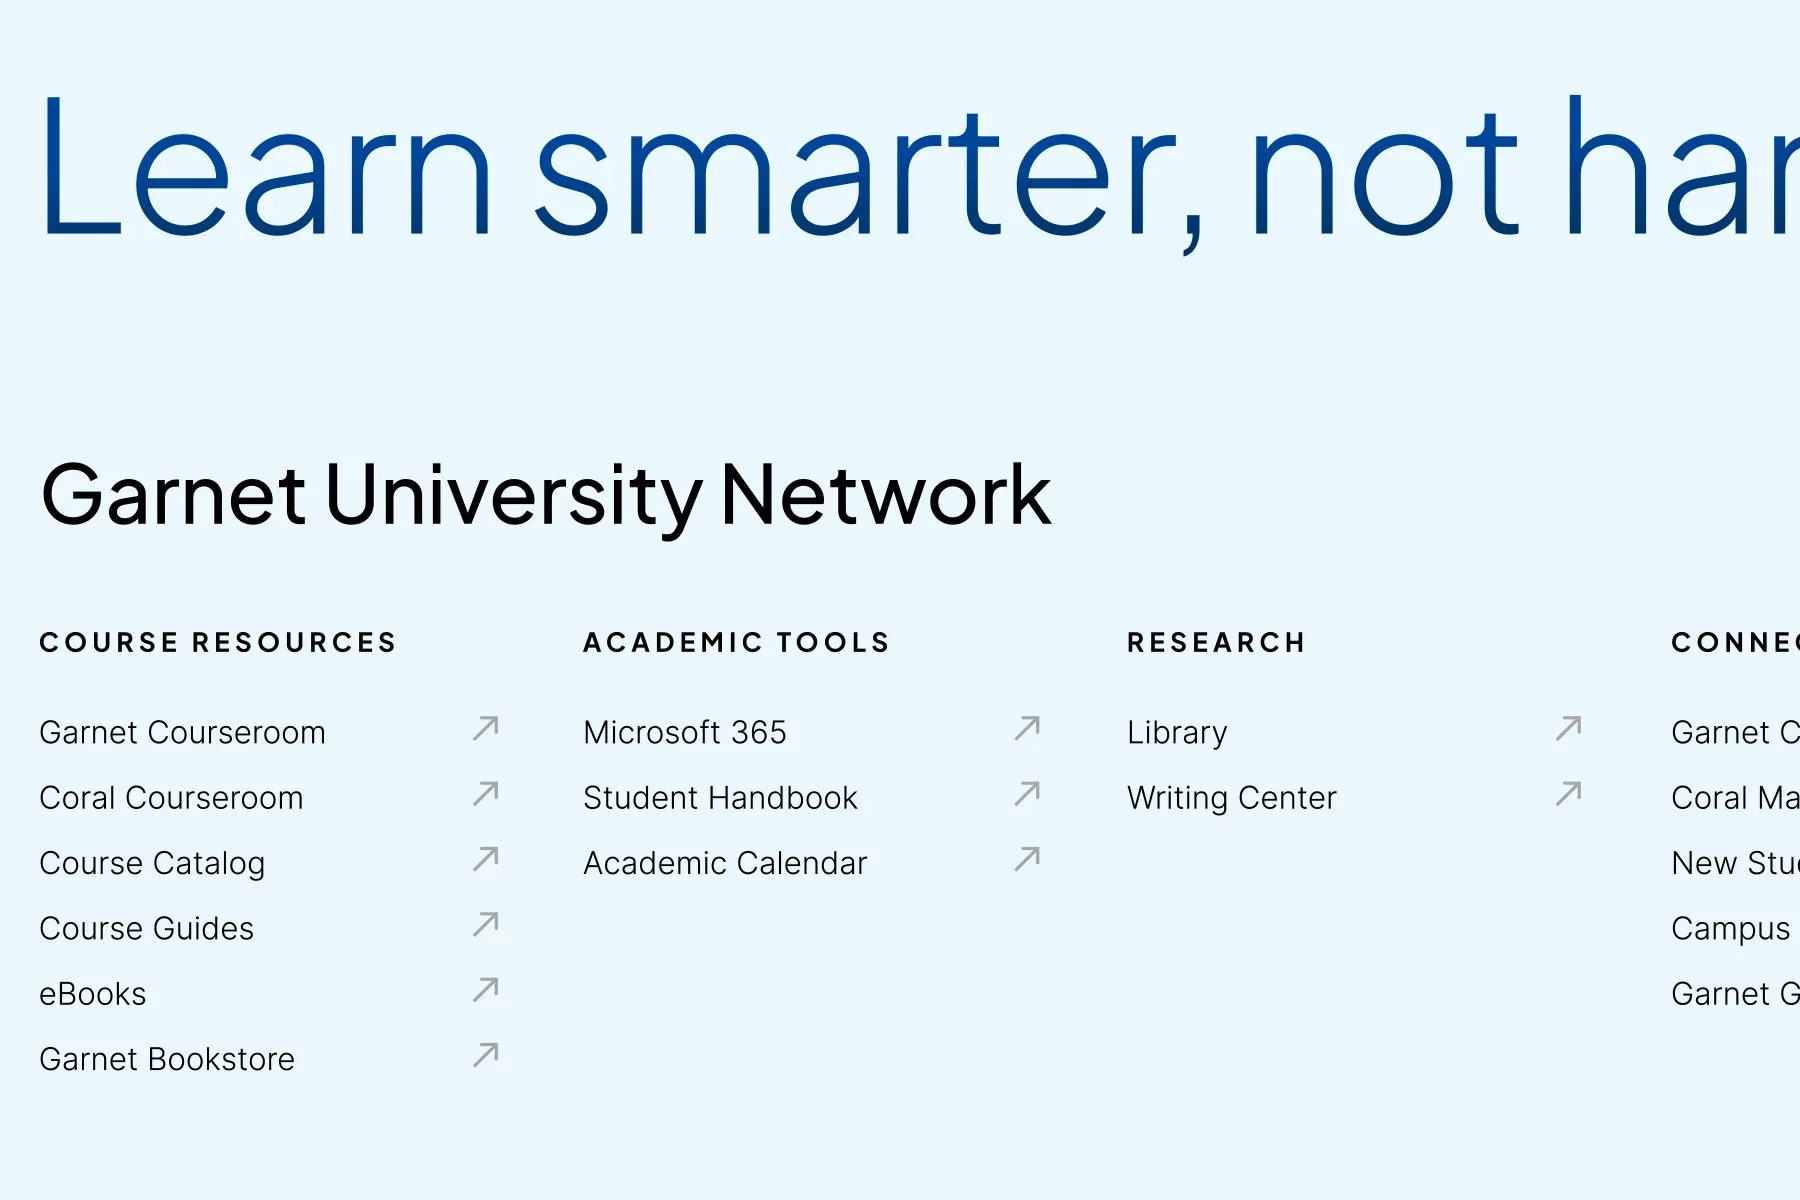
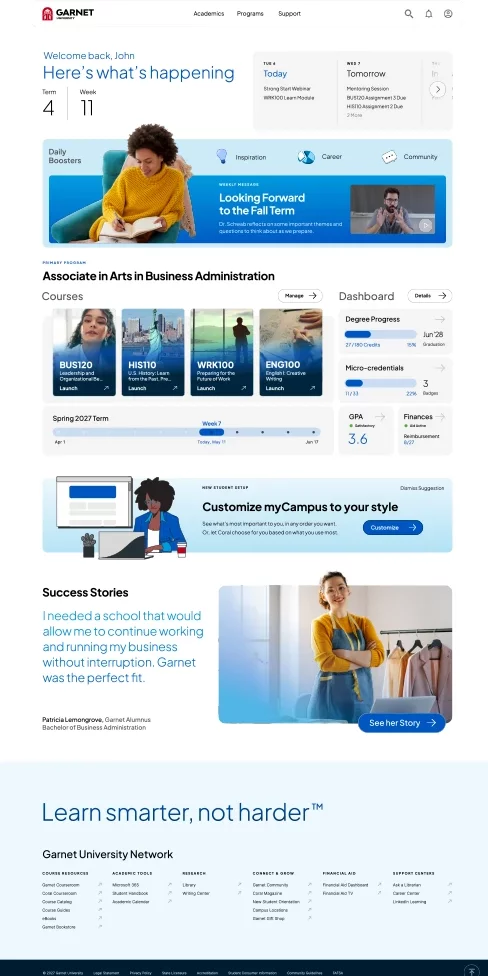
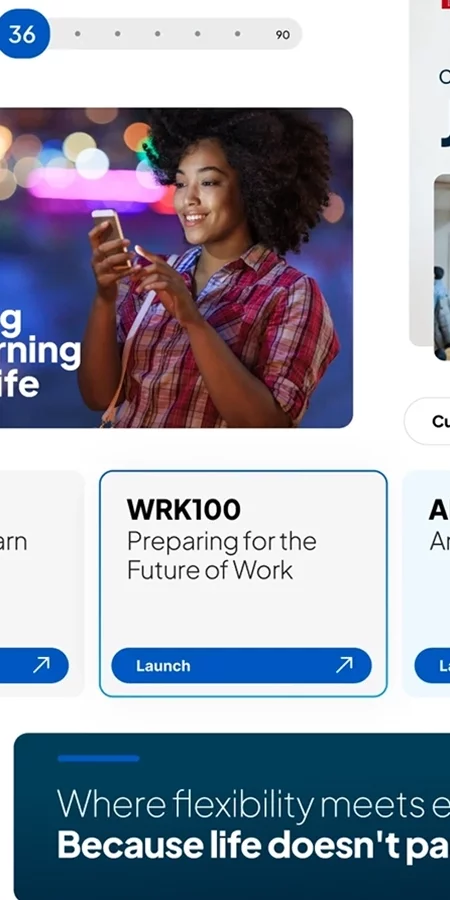
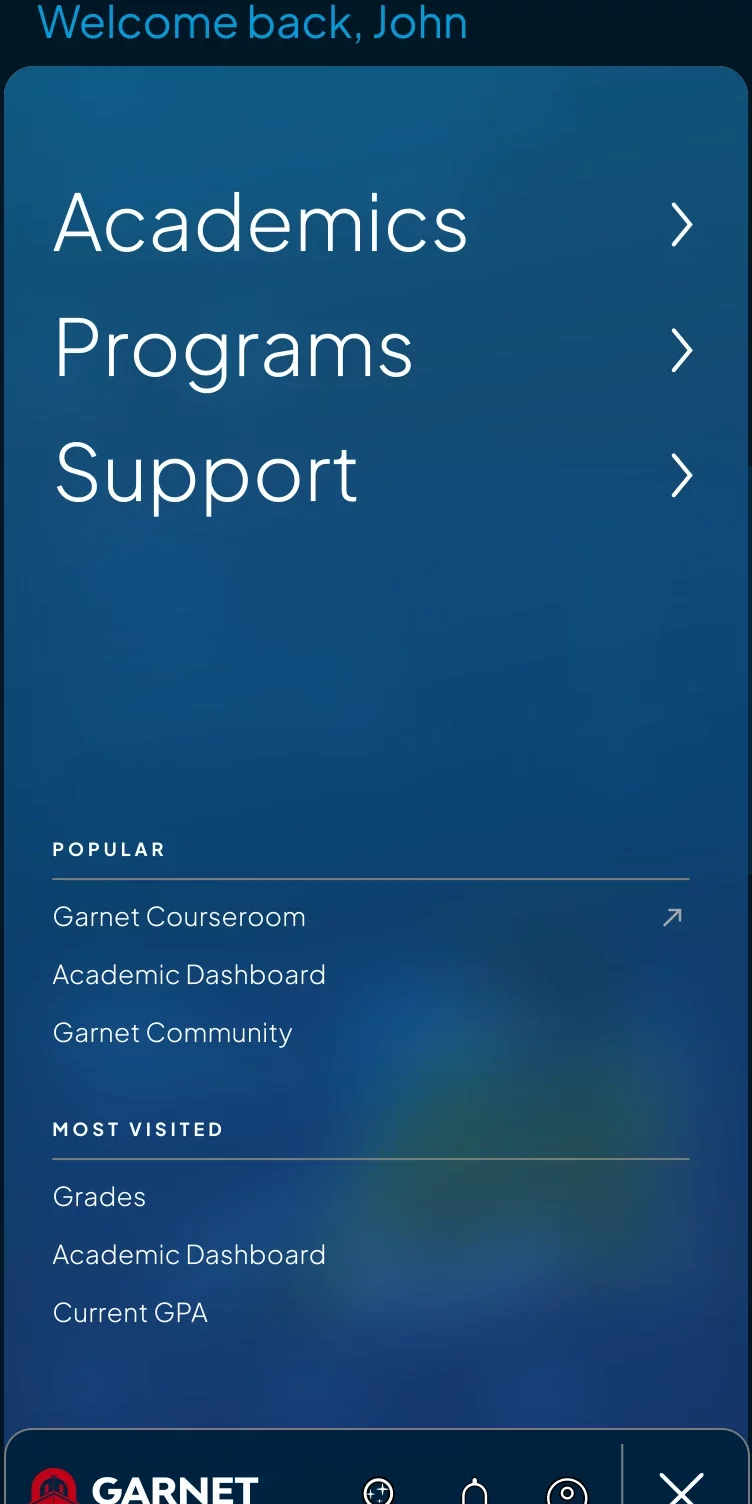
The old portal was cluttered by corpo-centric mandates. Repeated information resulting from lack of cross-team coordination. Inconsistent with branding in other student experiences, including their own website.
Here’s how I approached each set of goals and crafted solutions.
Experience
Core Initiatives
Simplicity
Support
User-centric
Interface
Design Principles
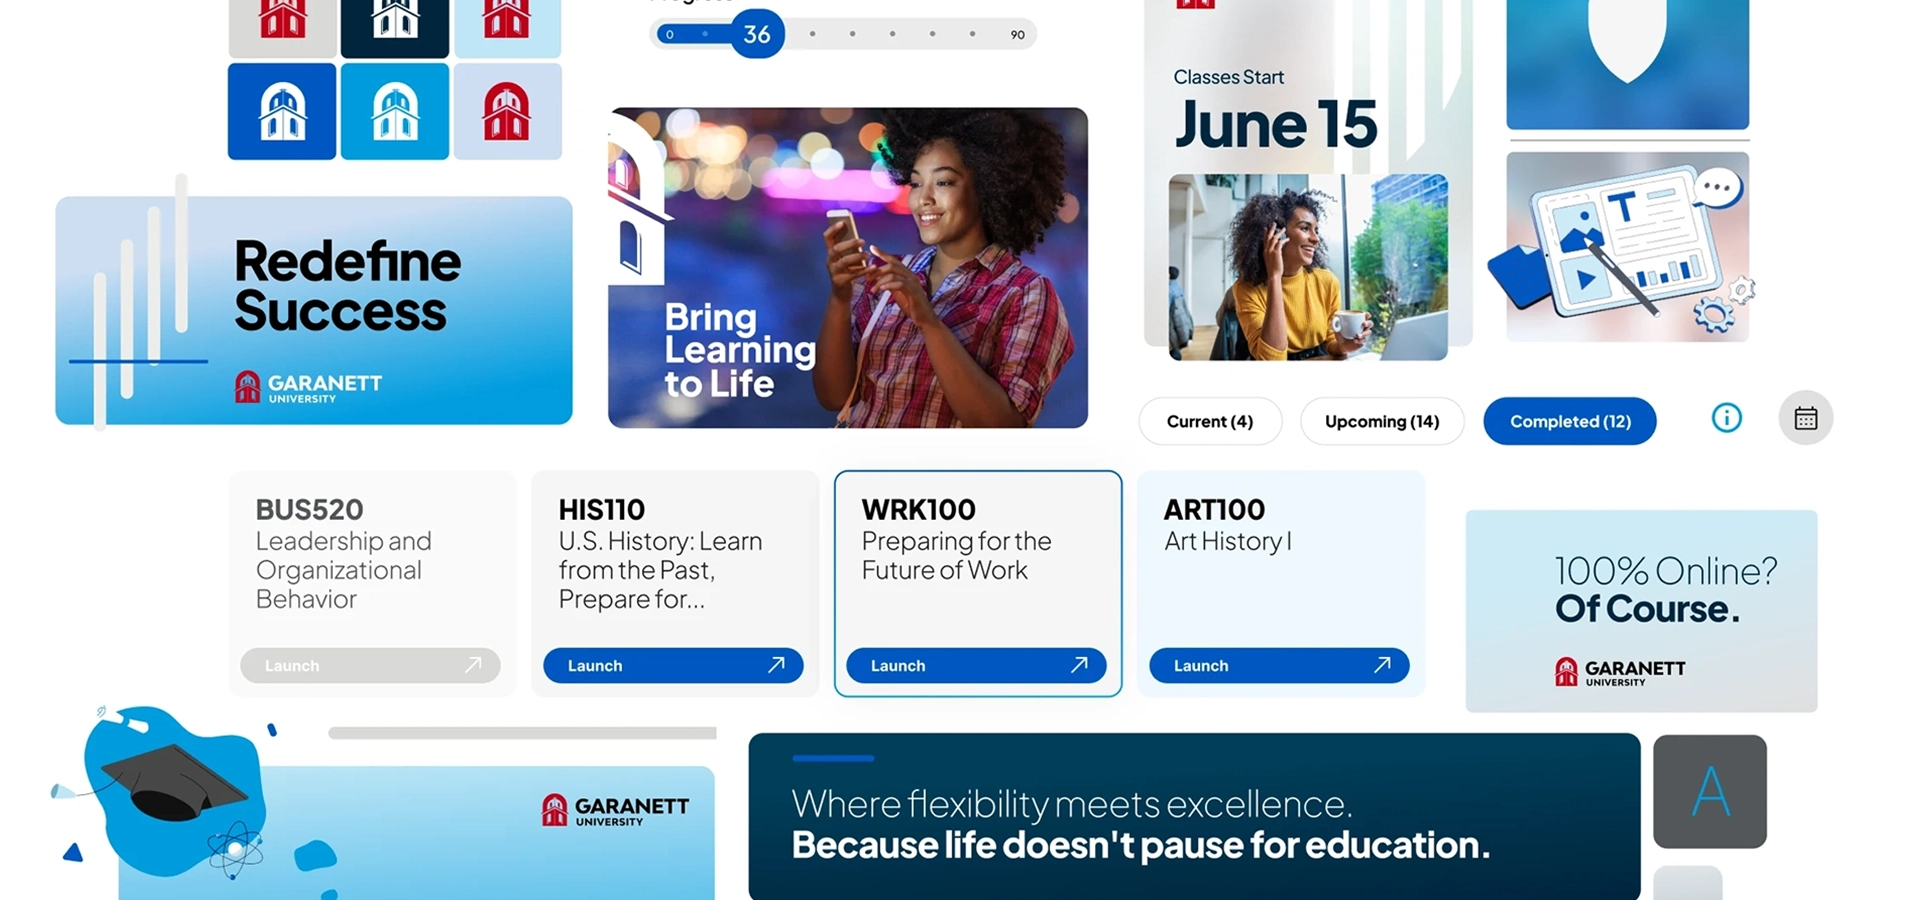
Consistency
Balance
Details
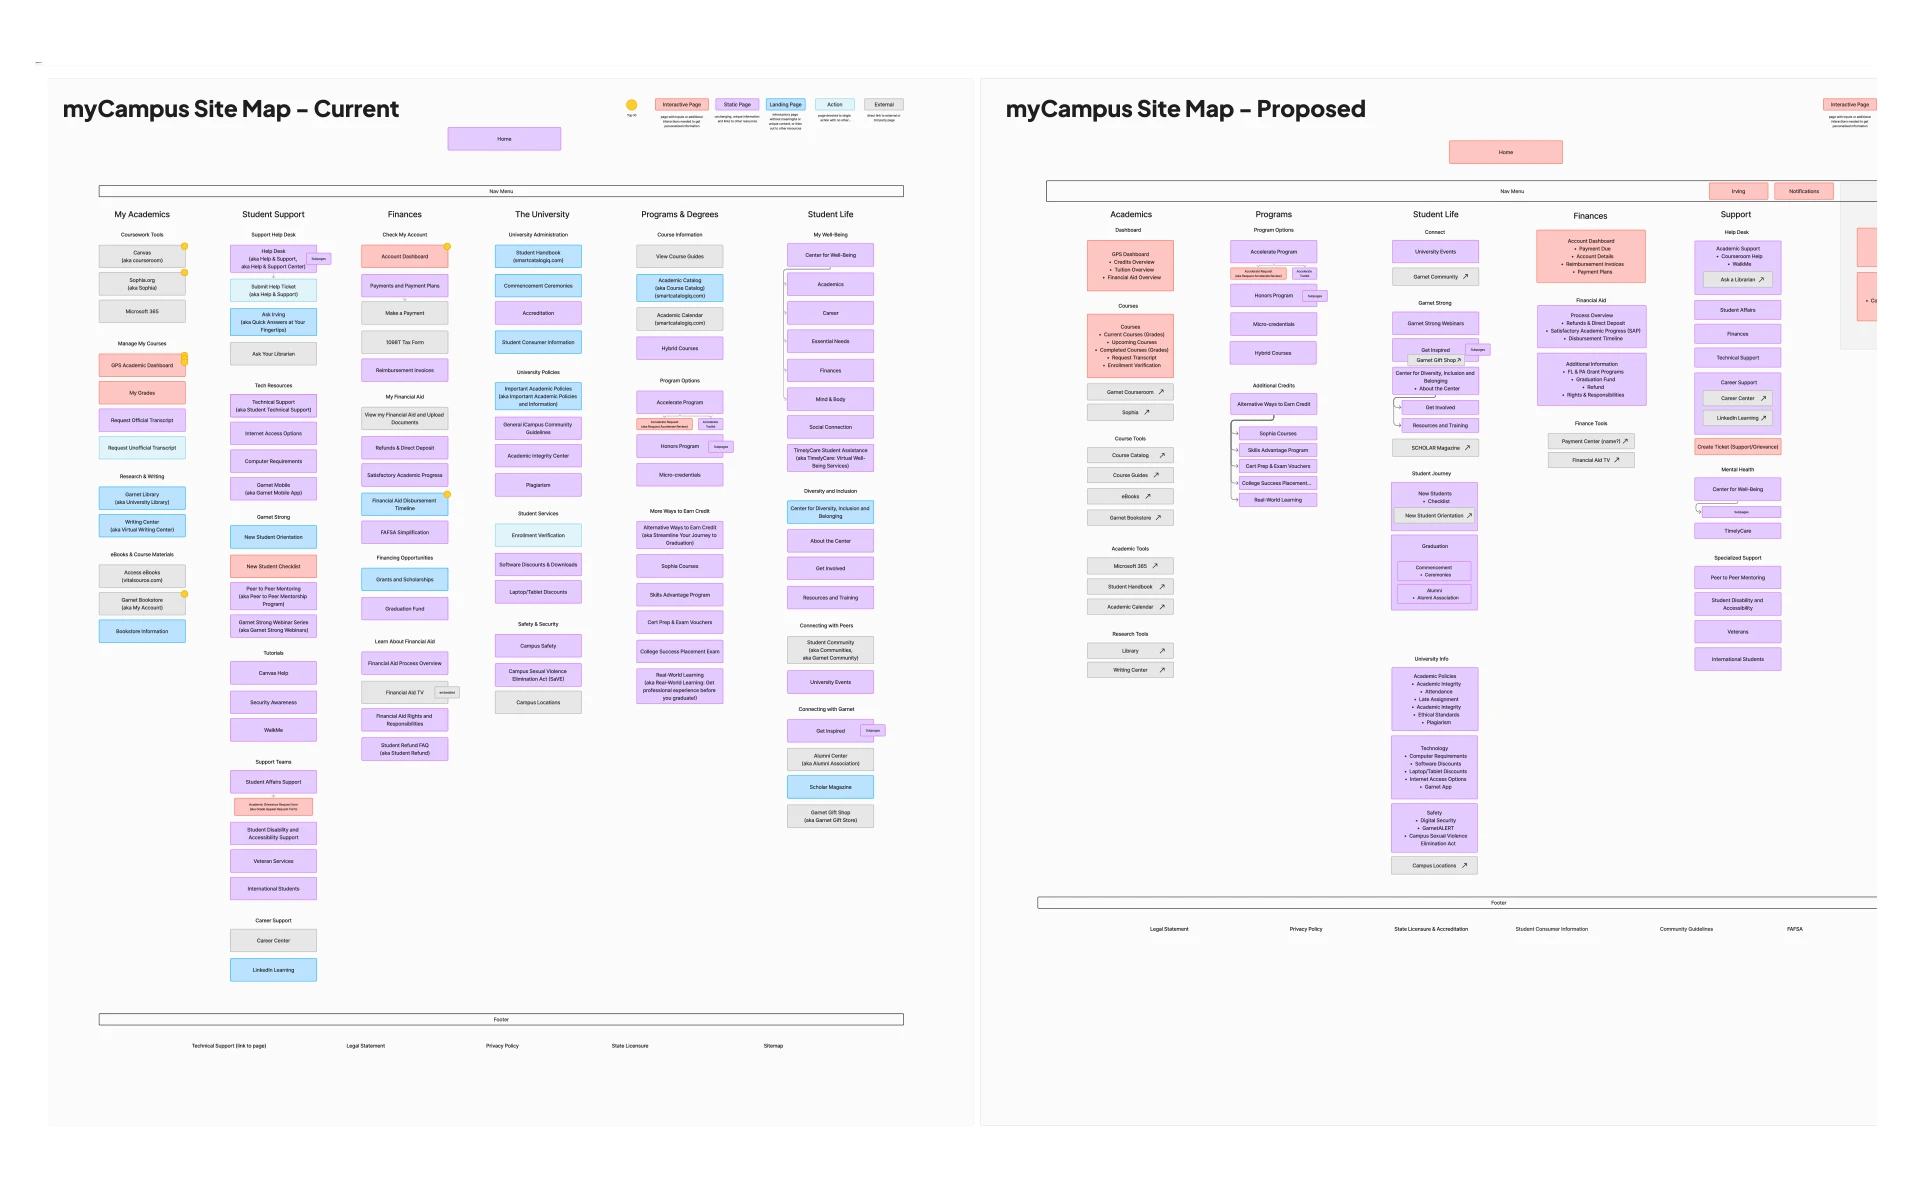
Site Structure
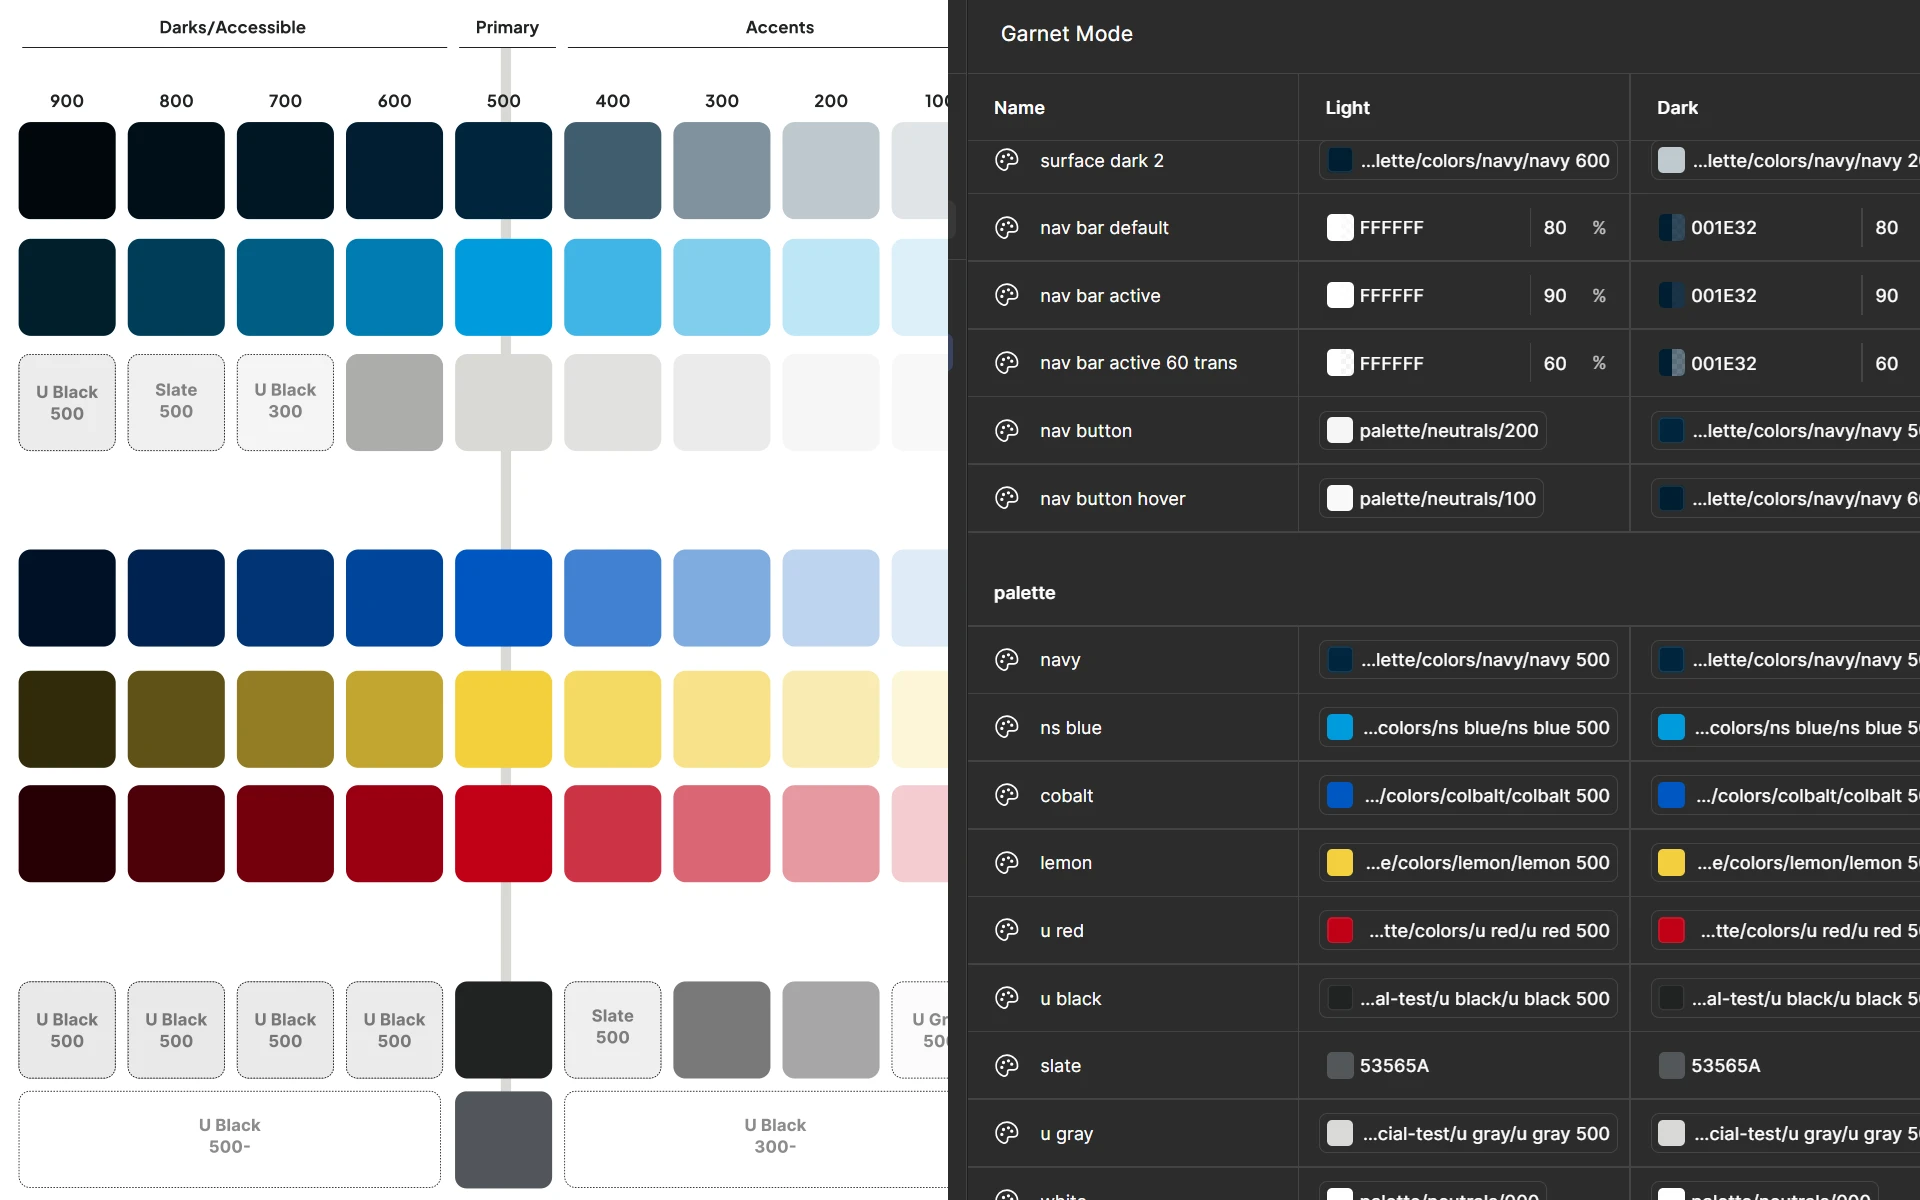
Color Palette
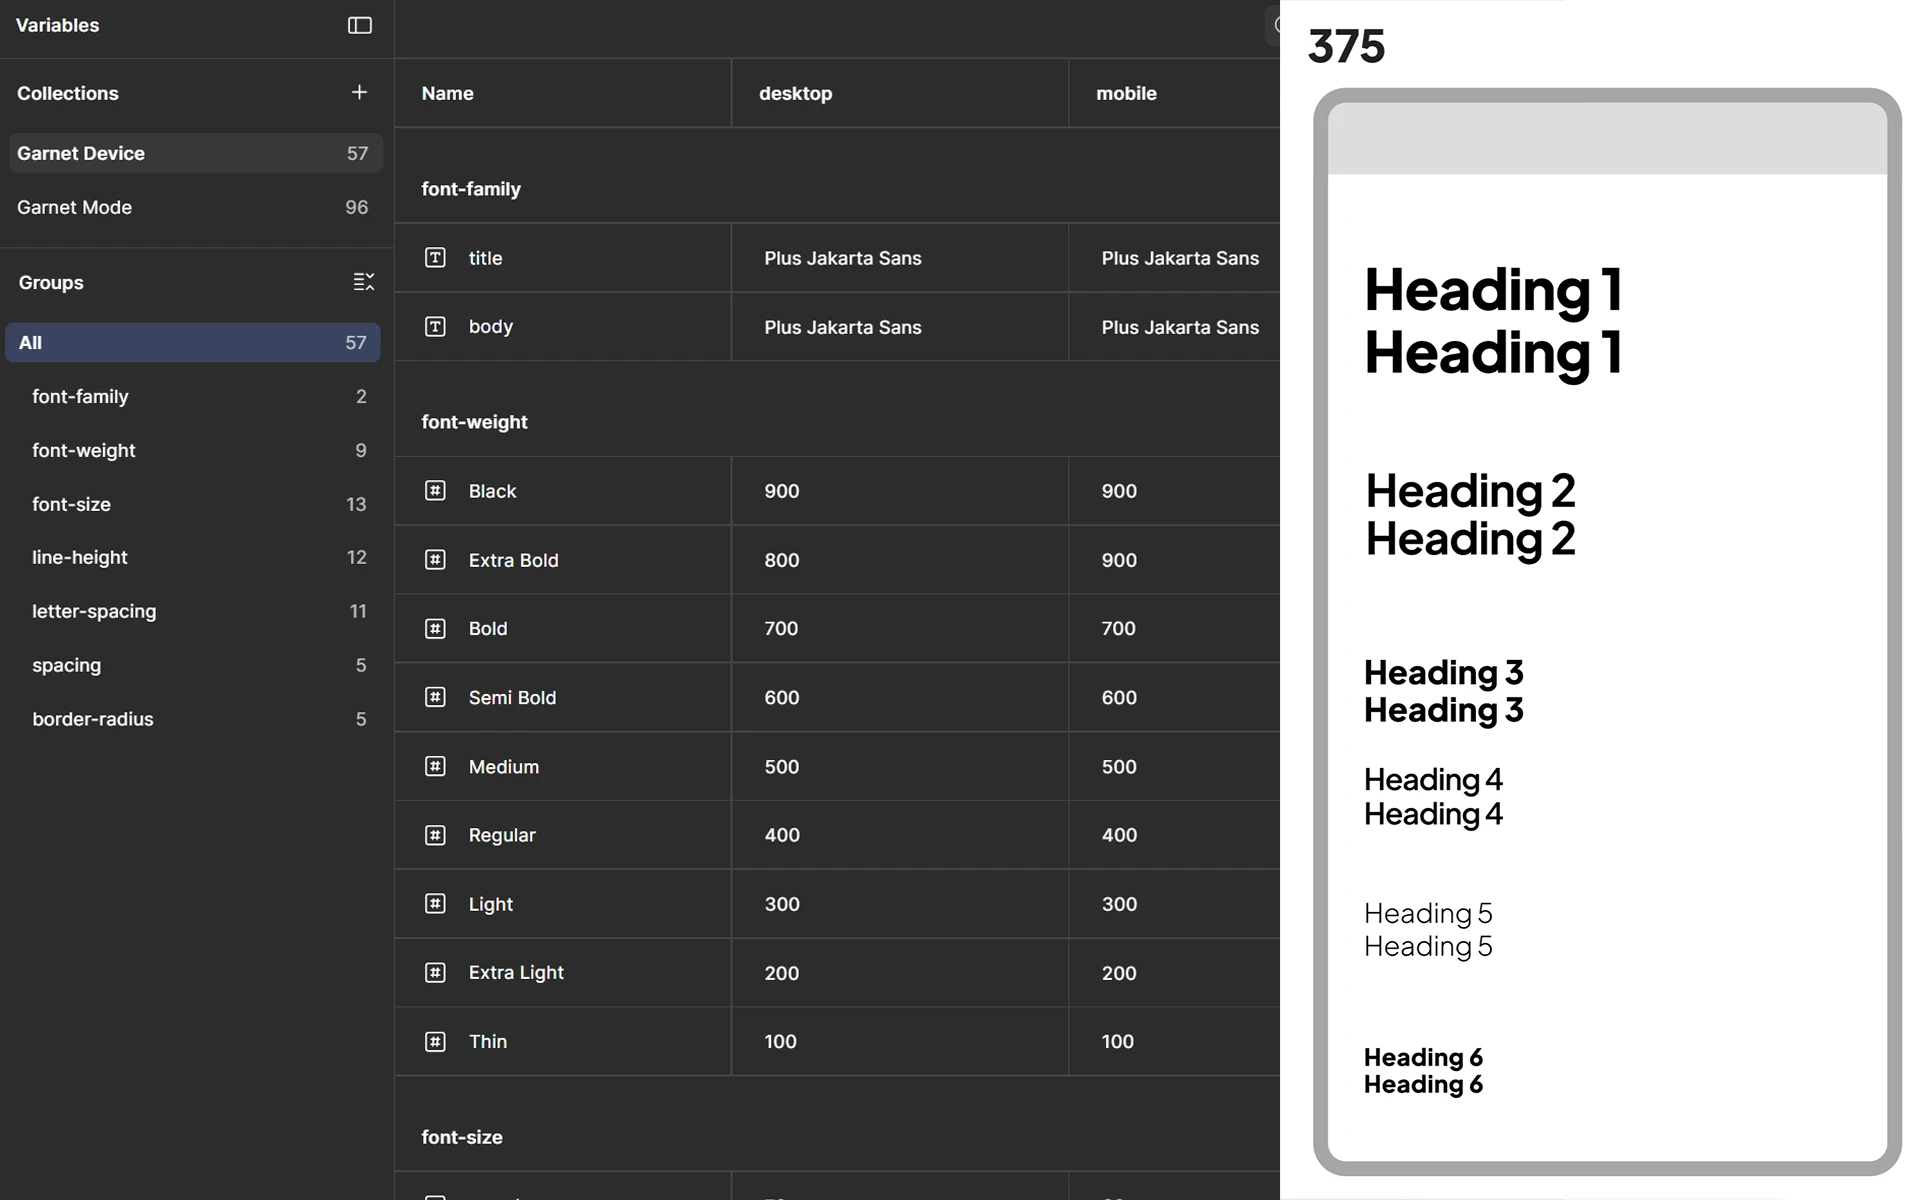
Modes
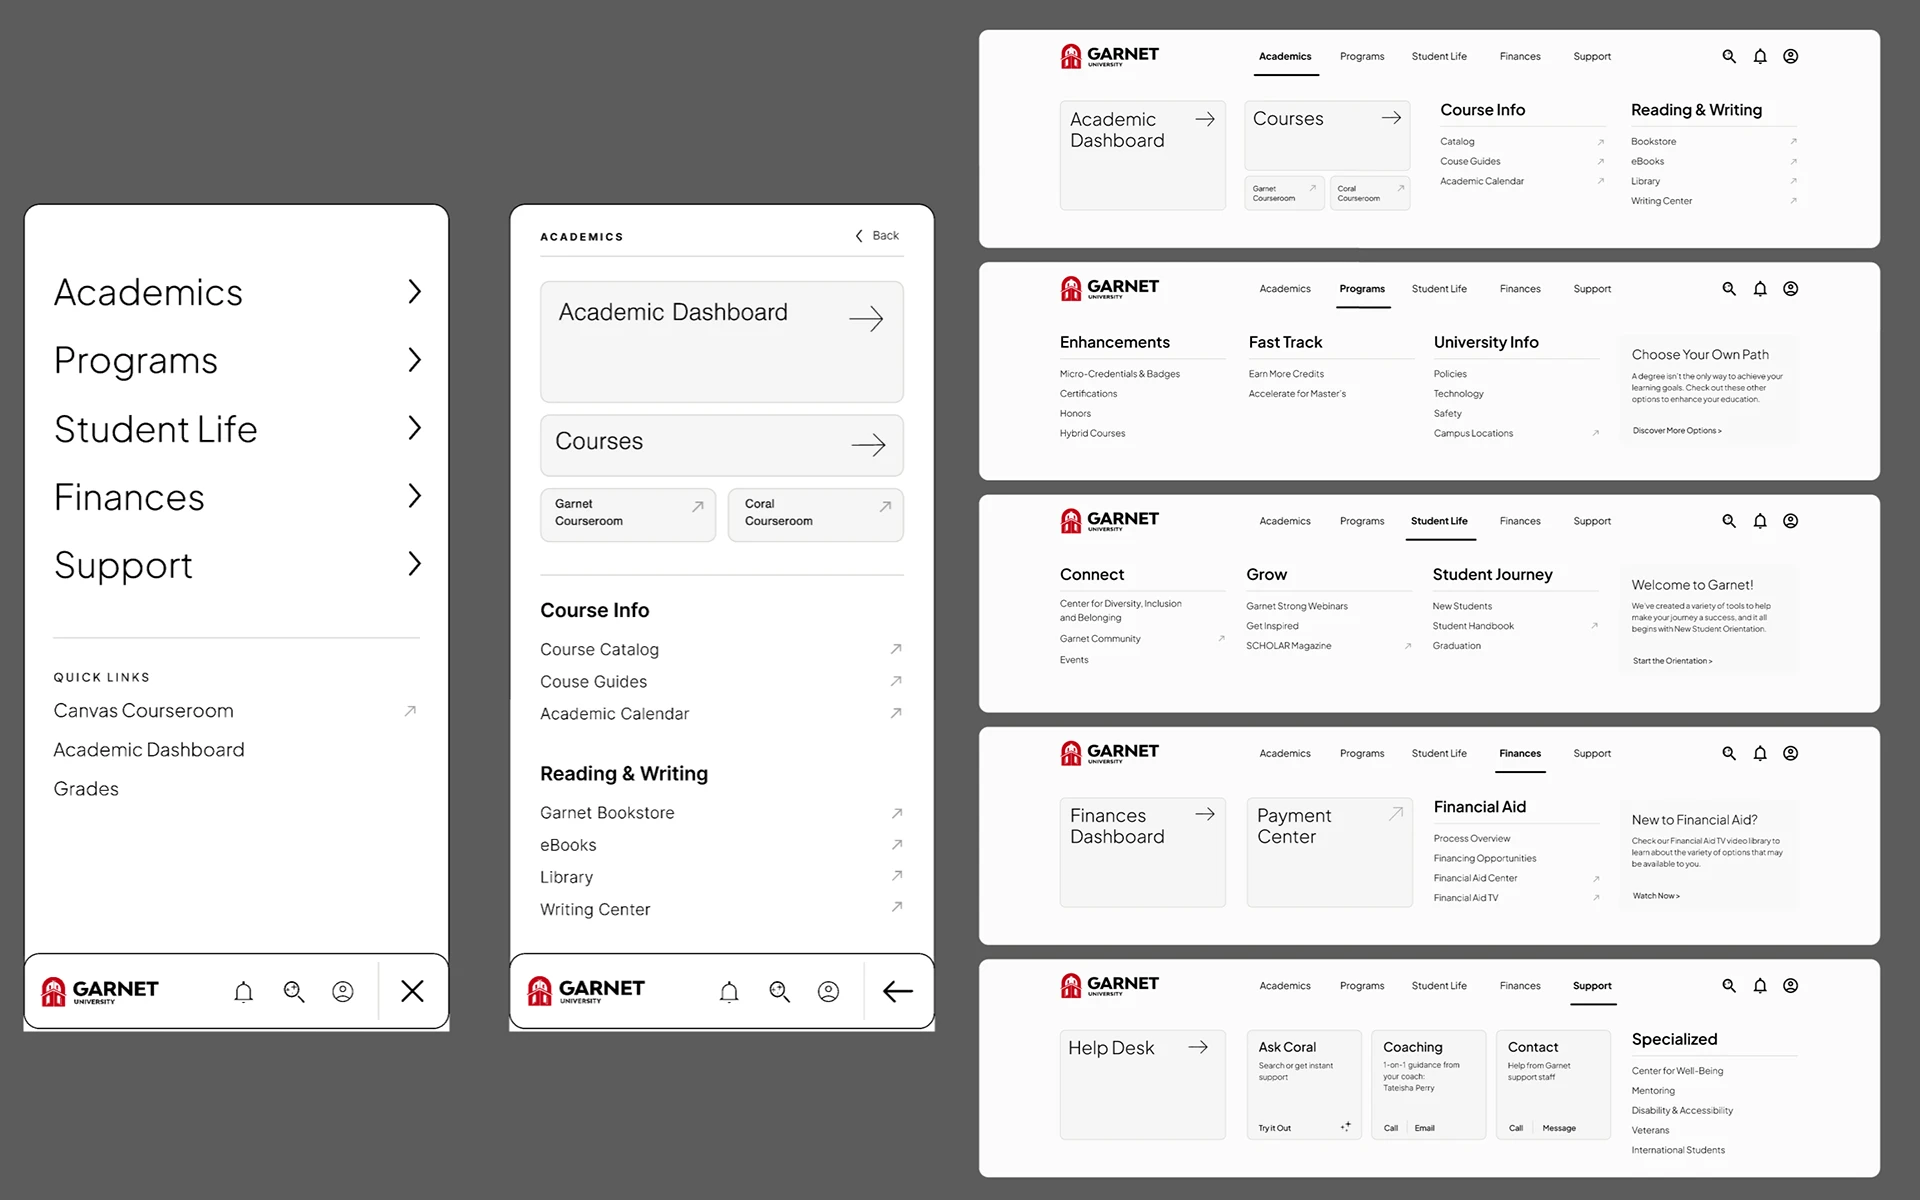
Wireframes
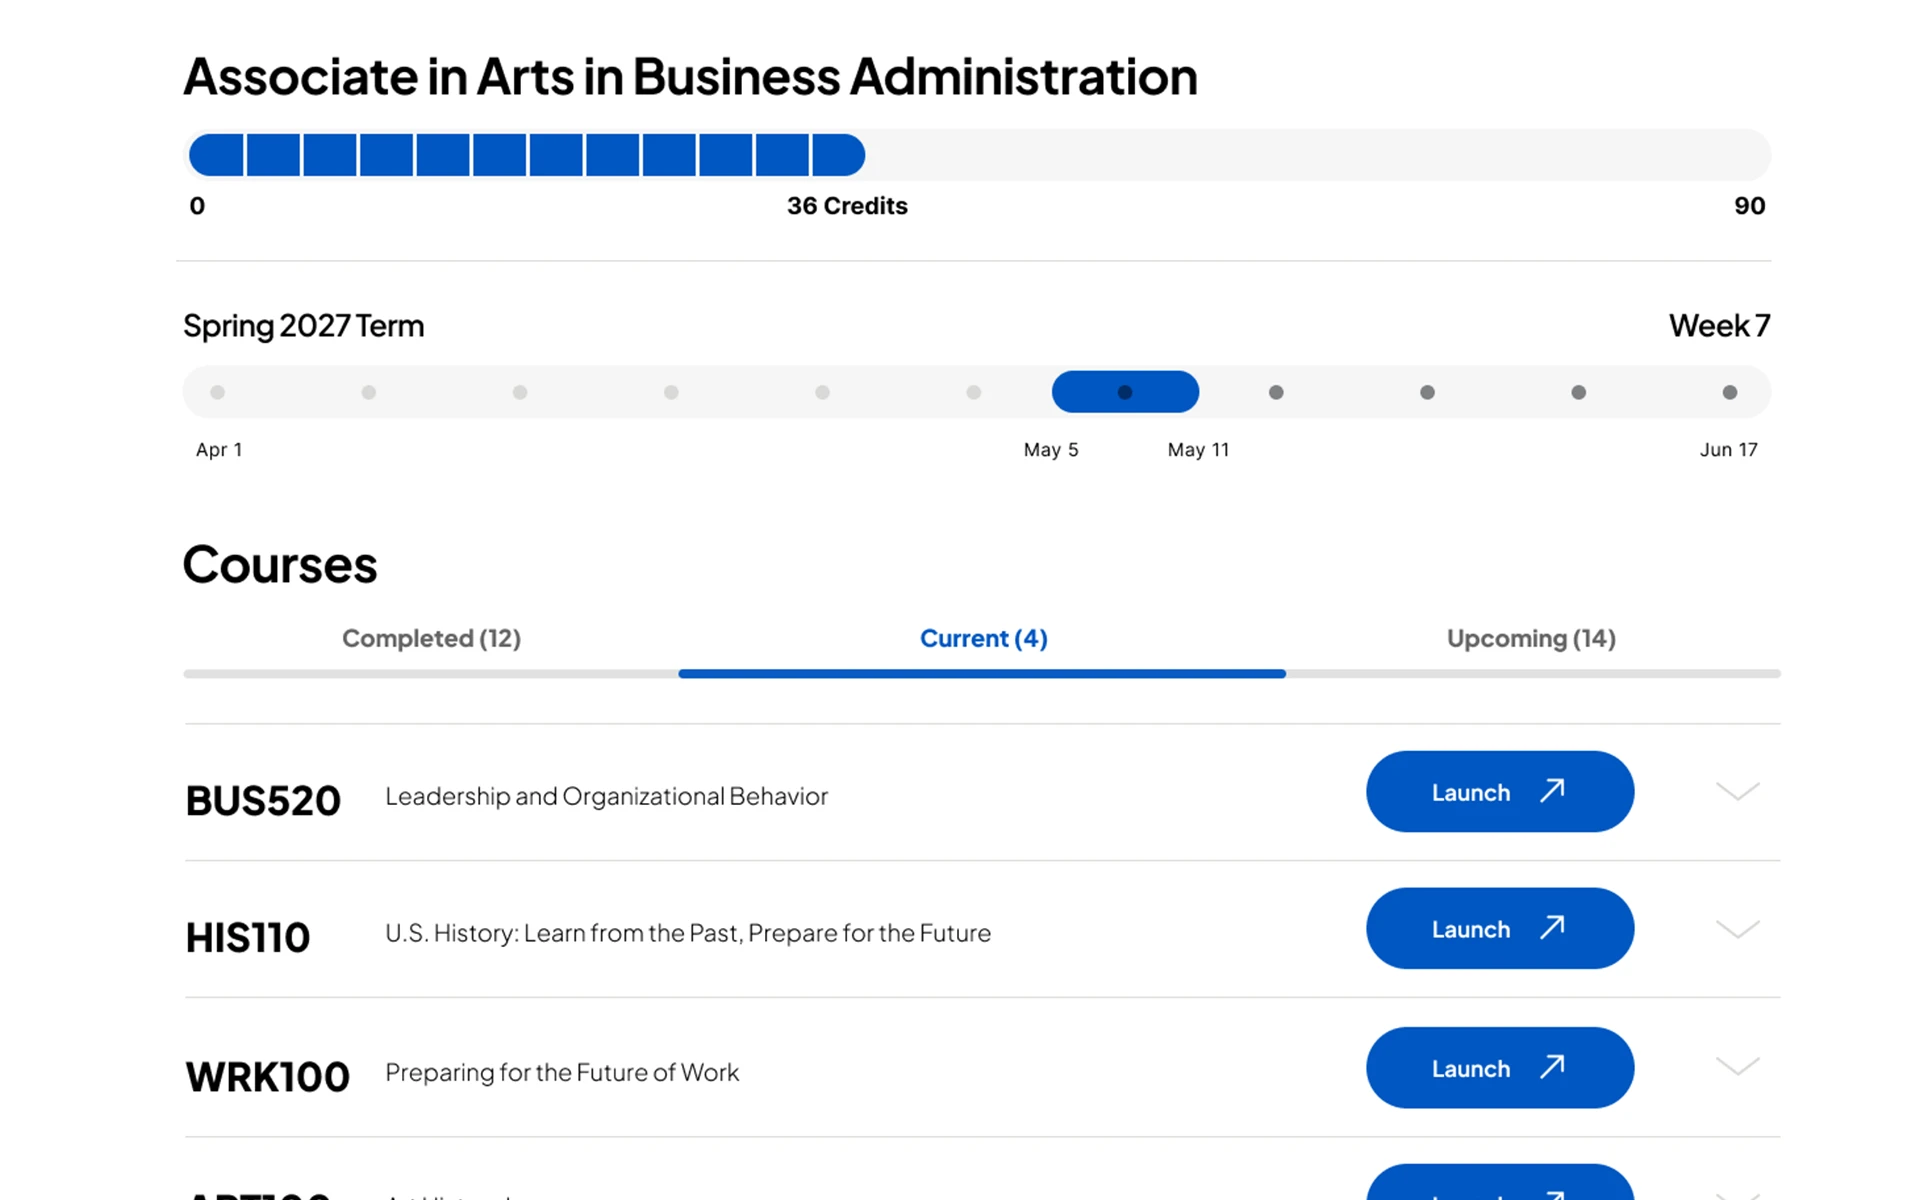
Style Development
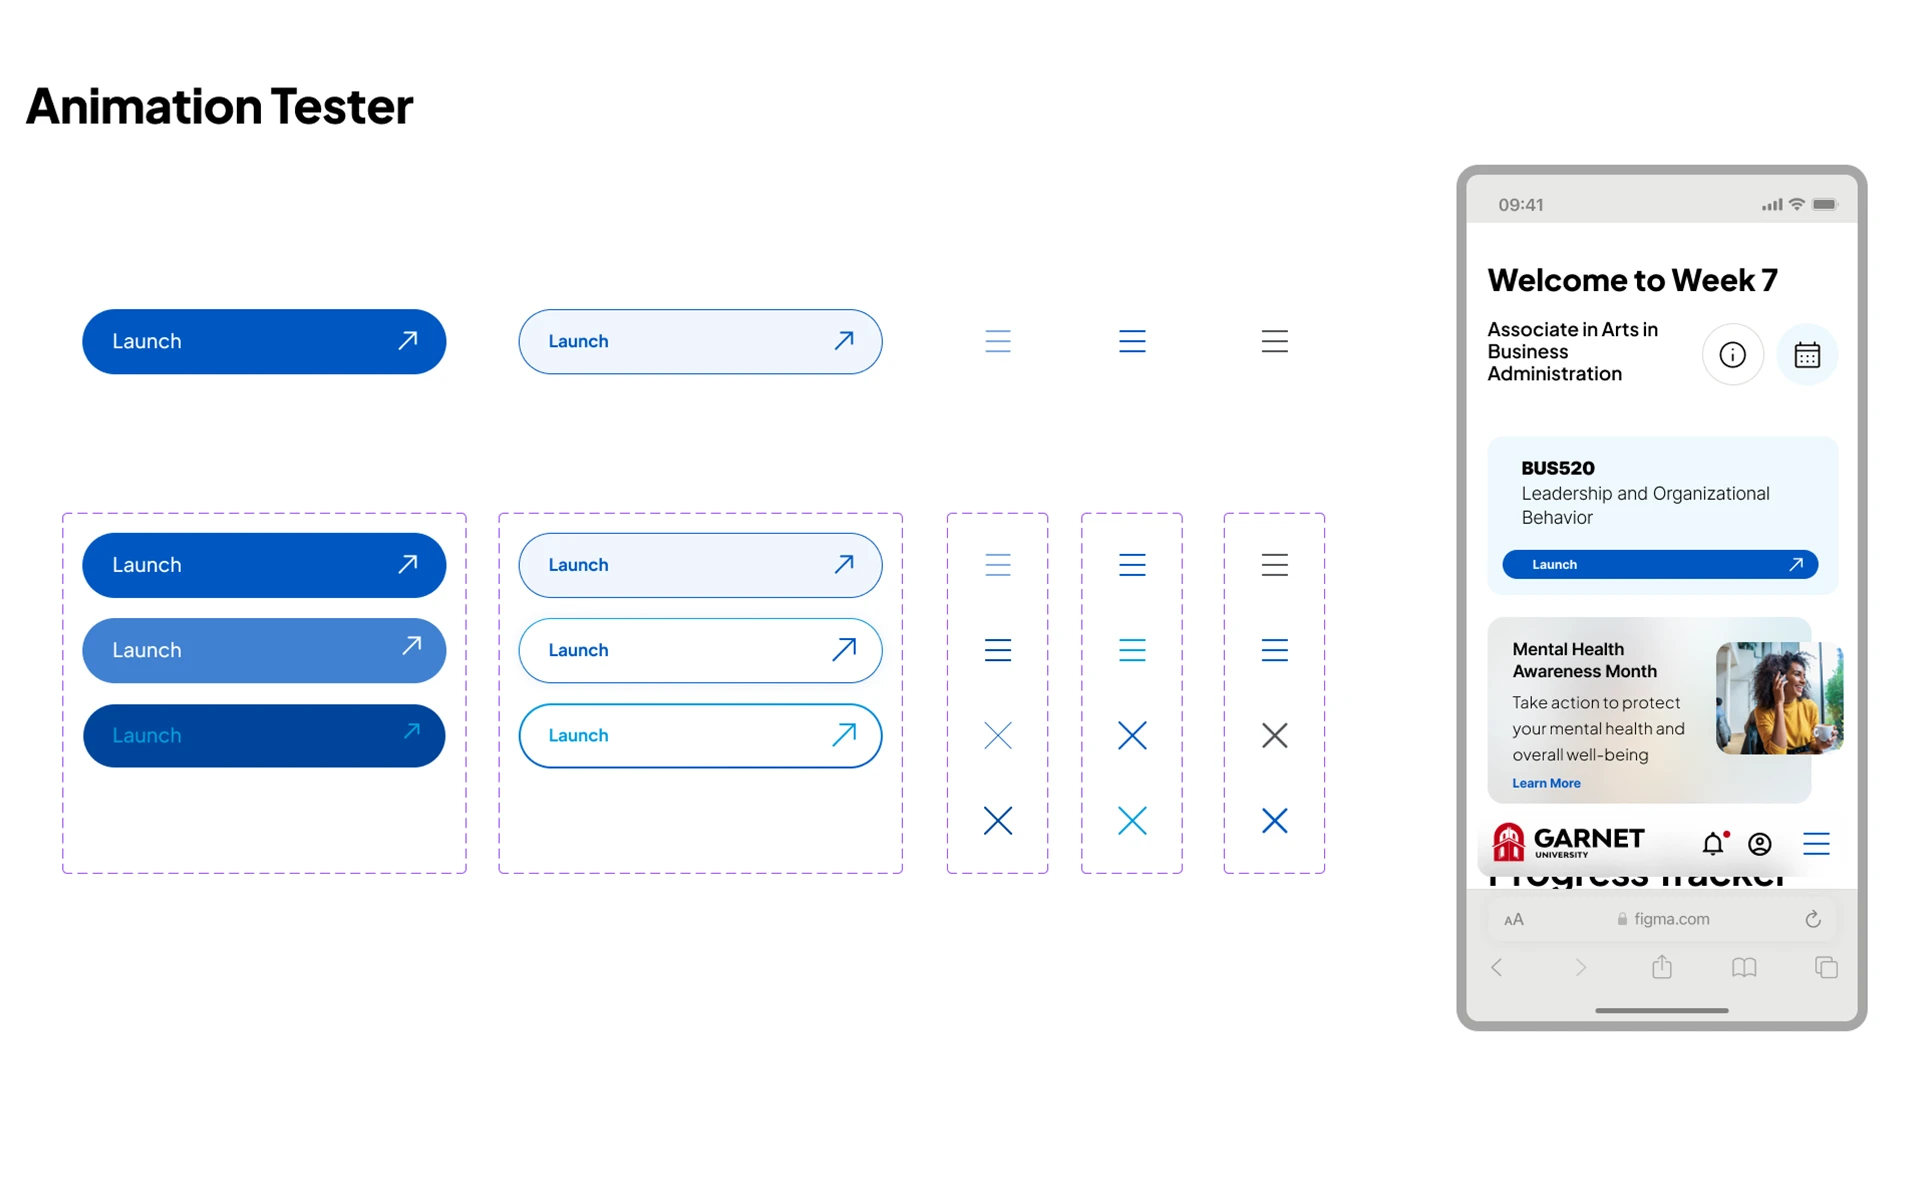
Animations
Structure
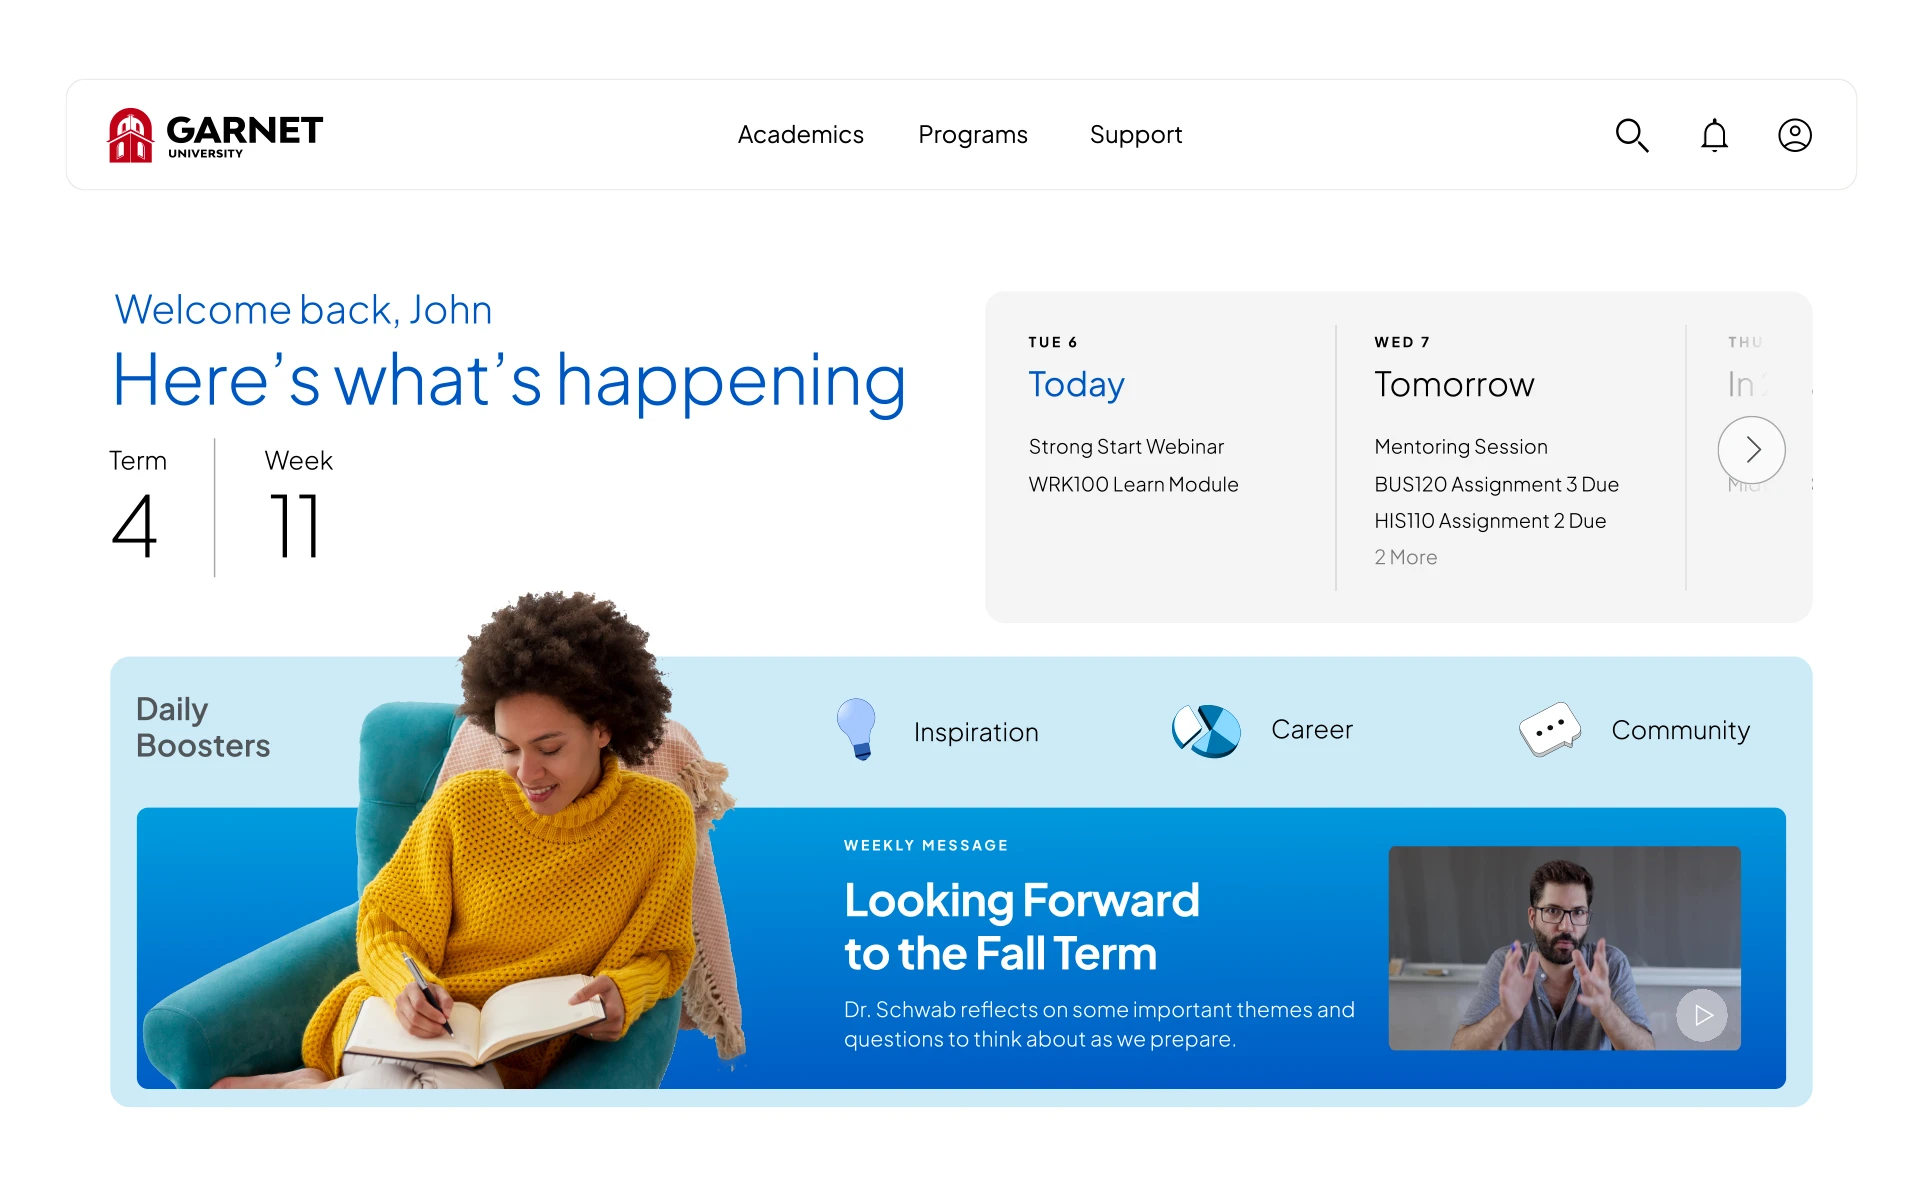
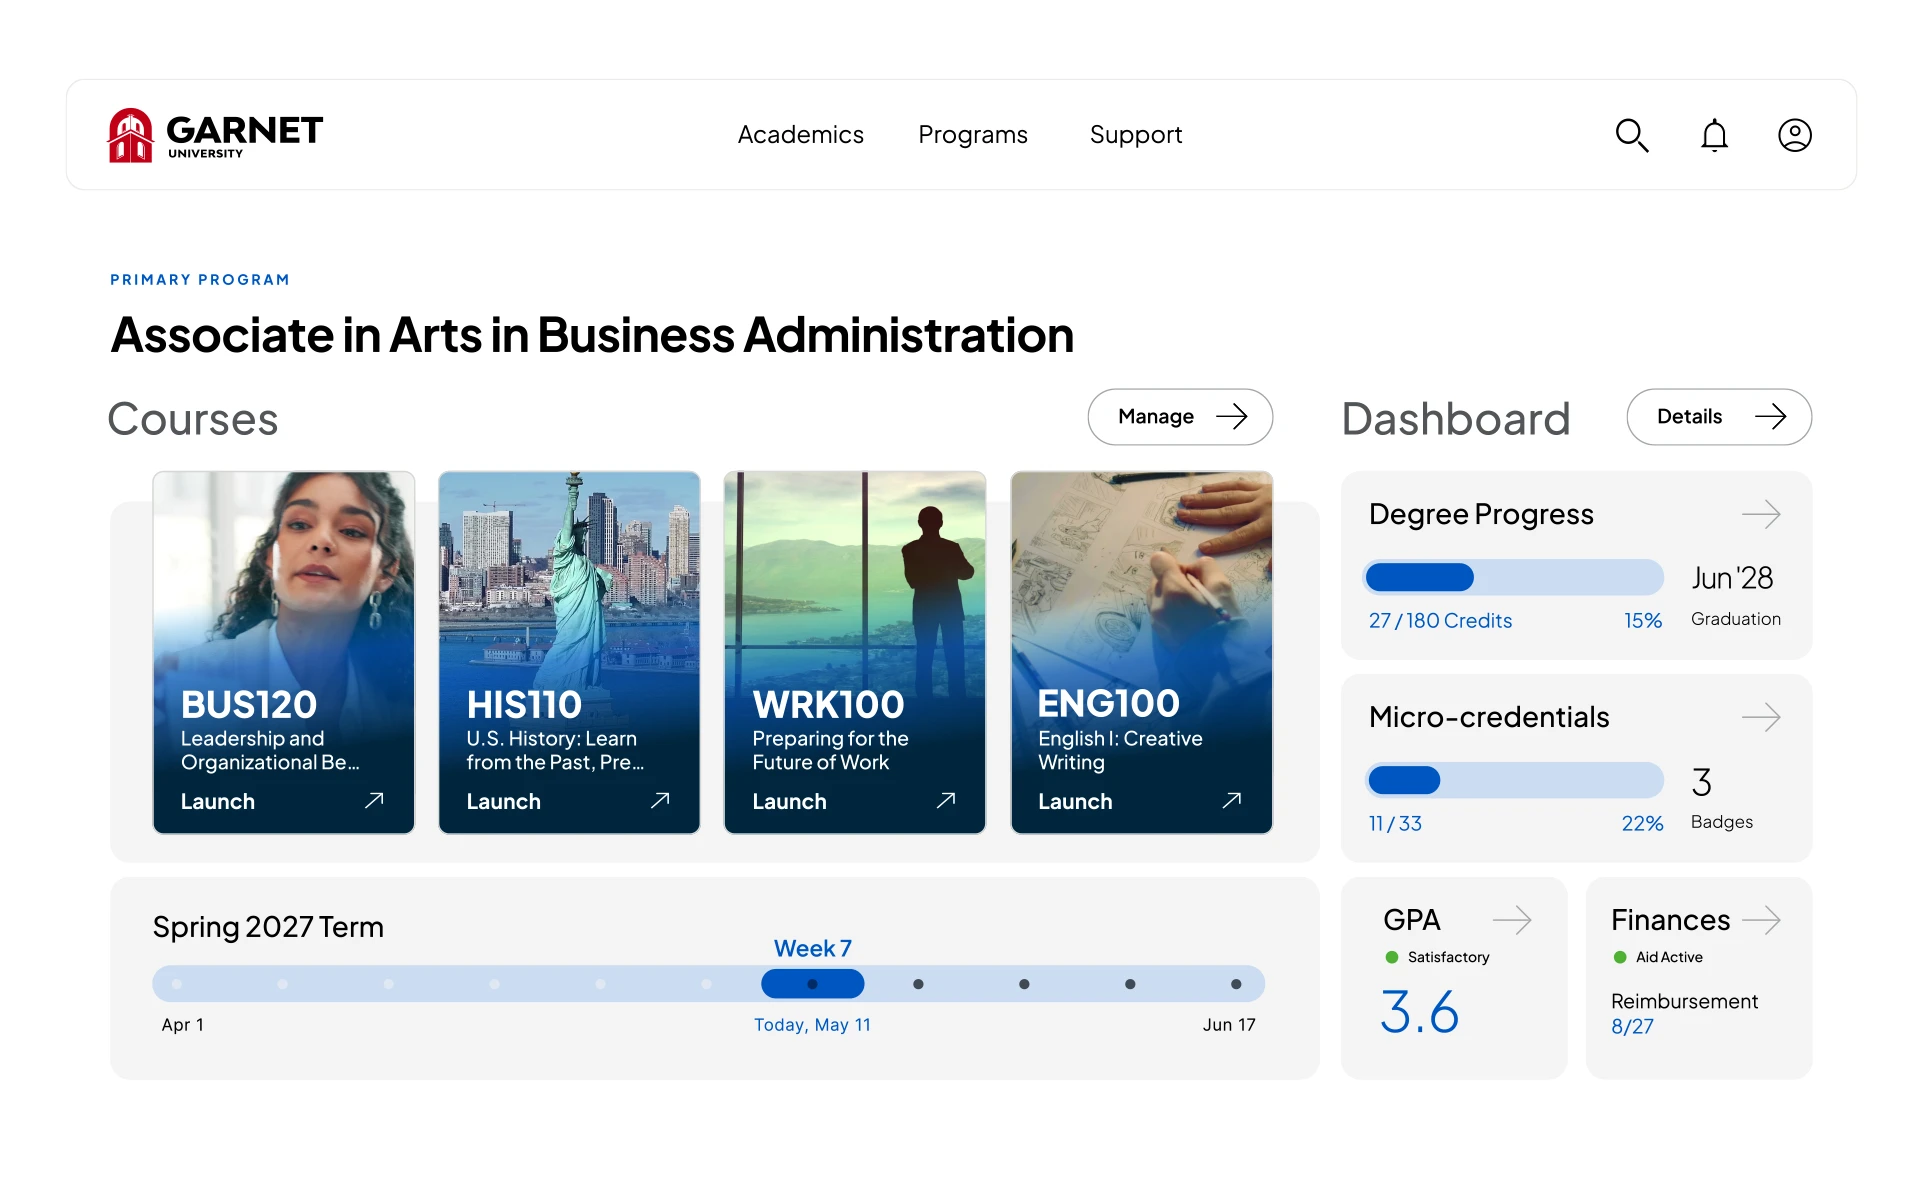
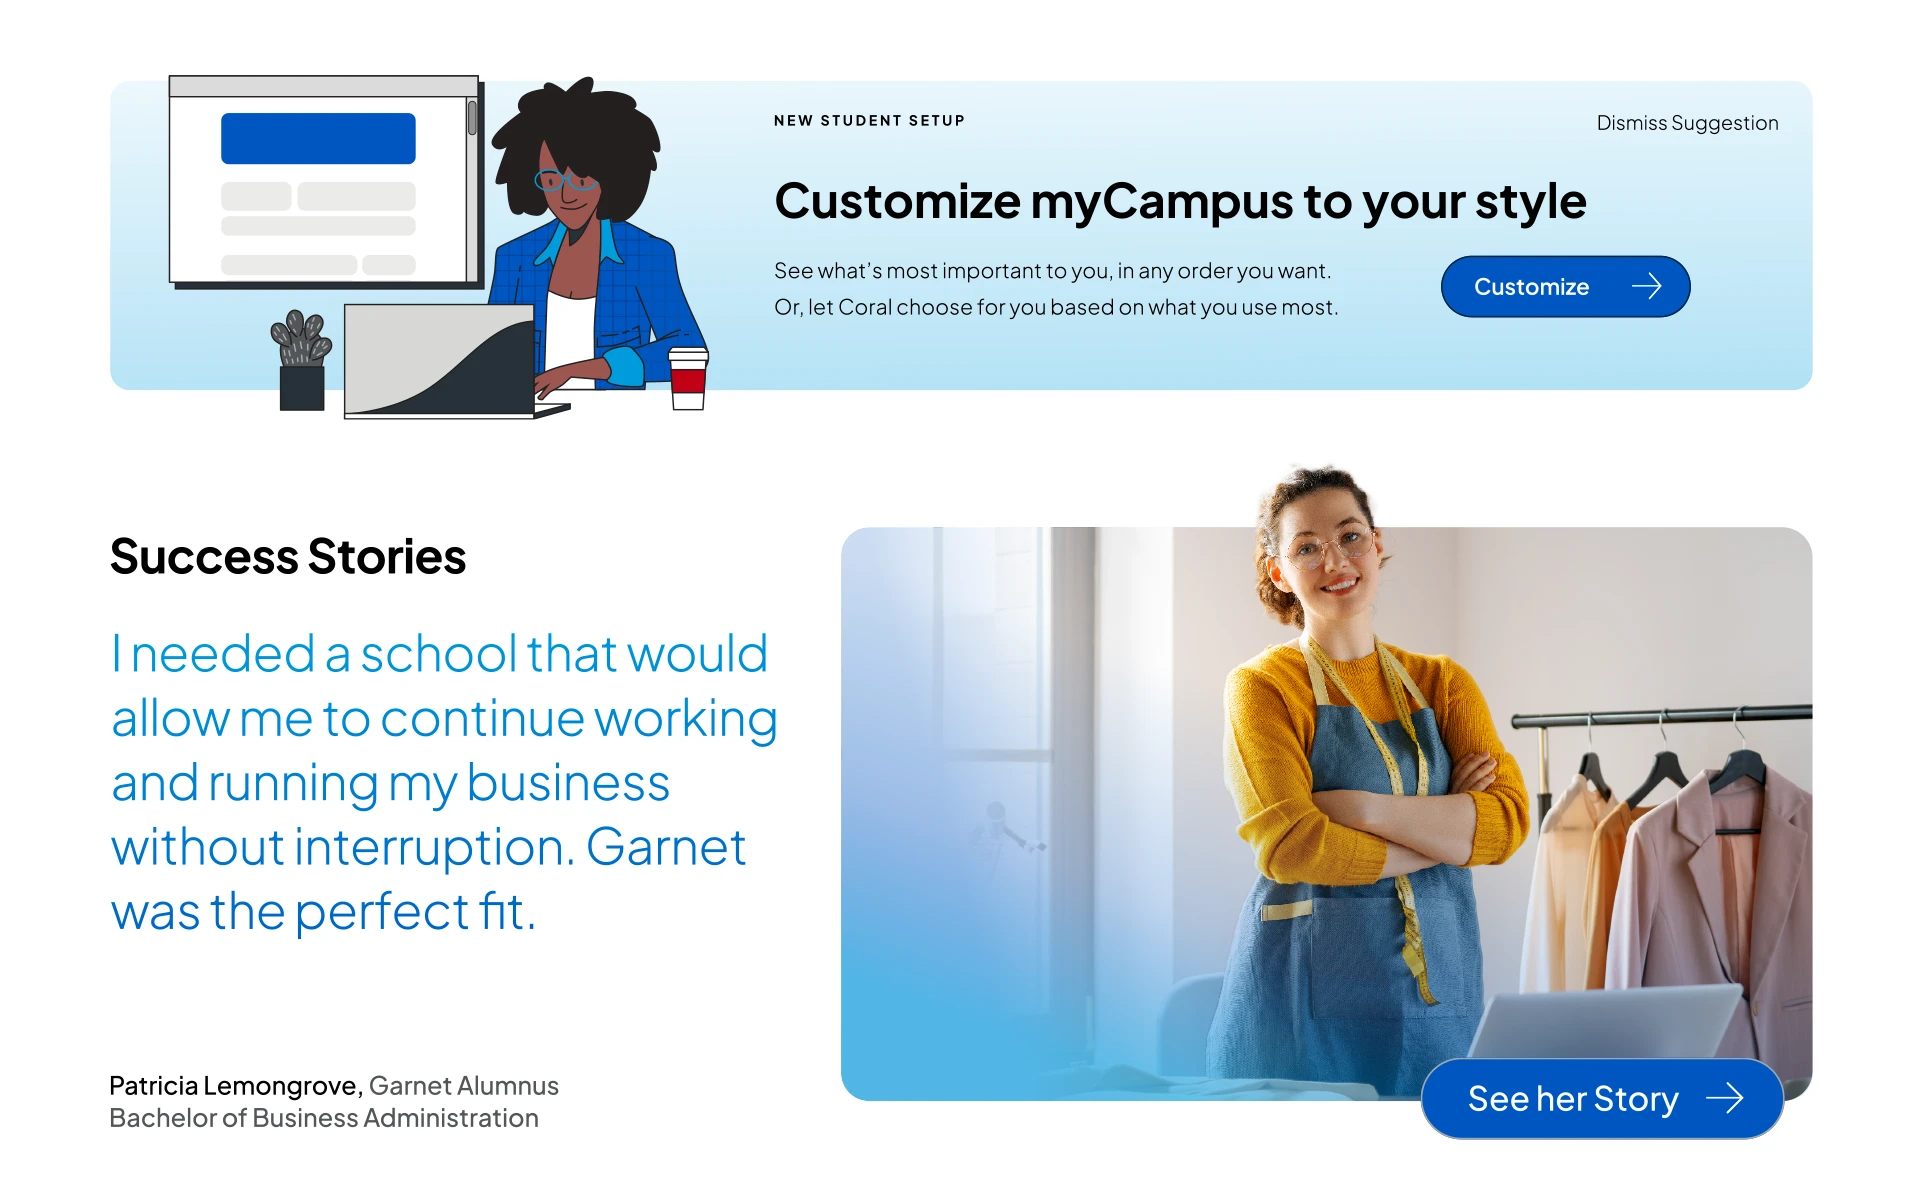


Features
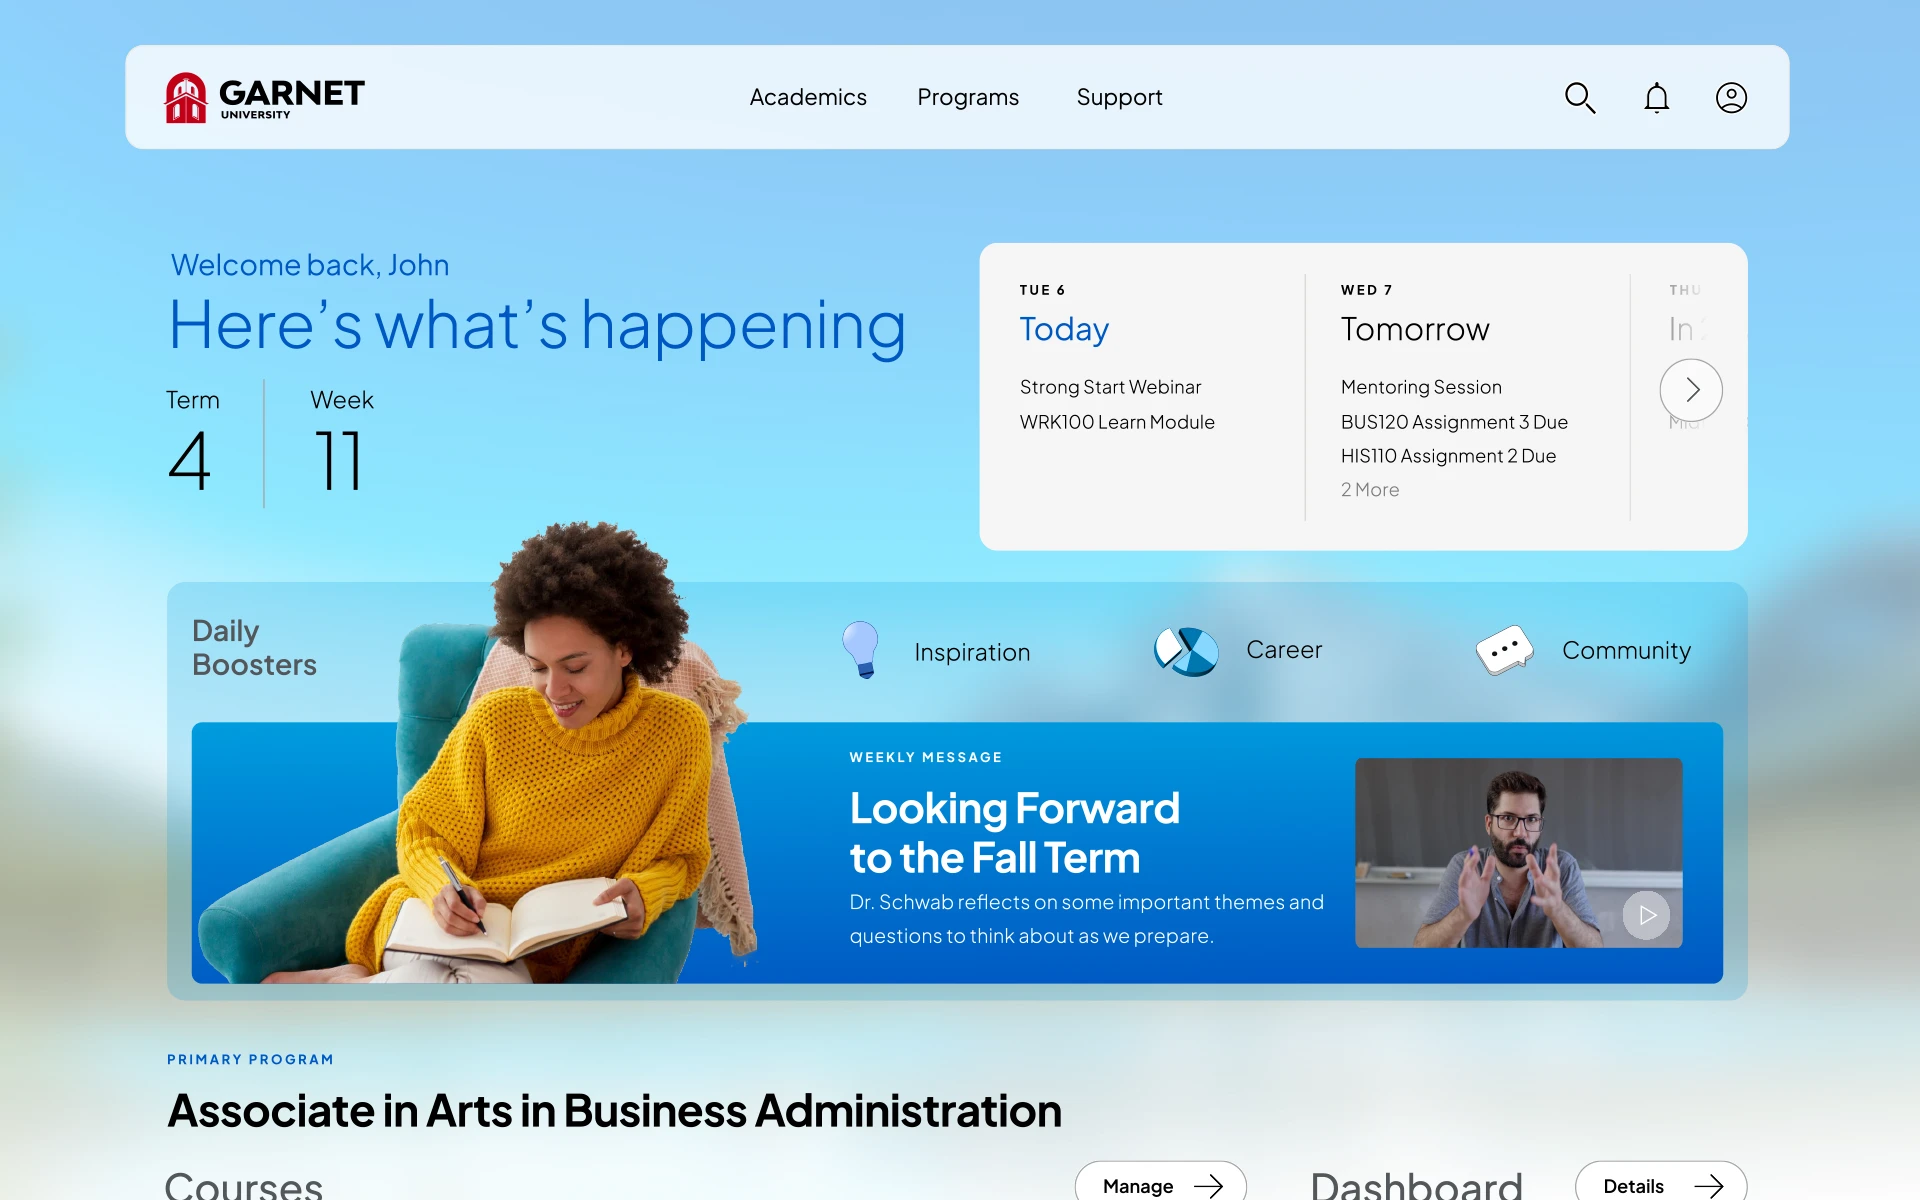
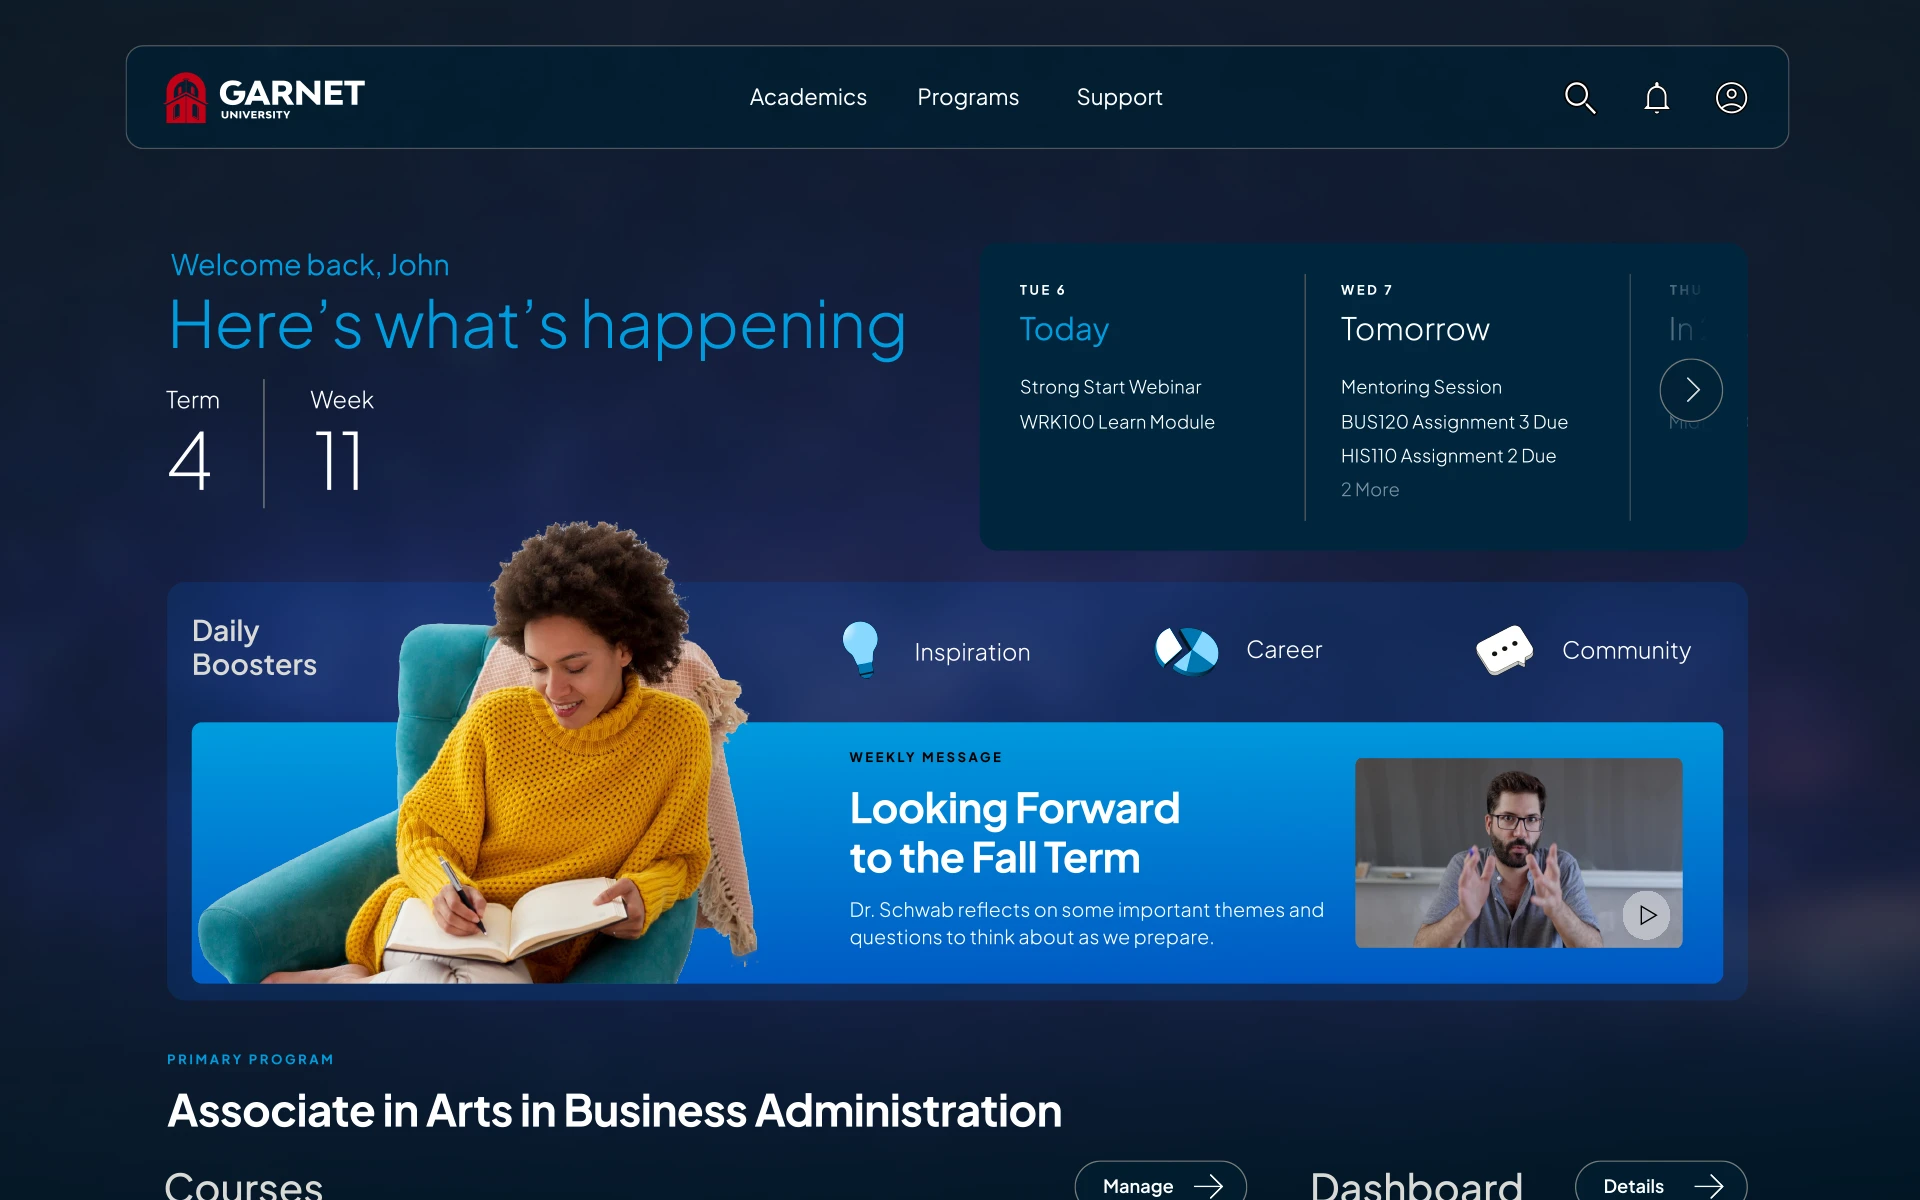

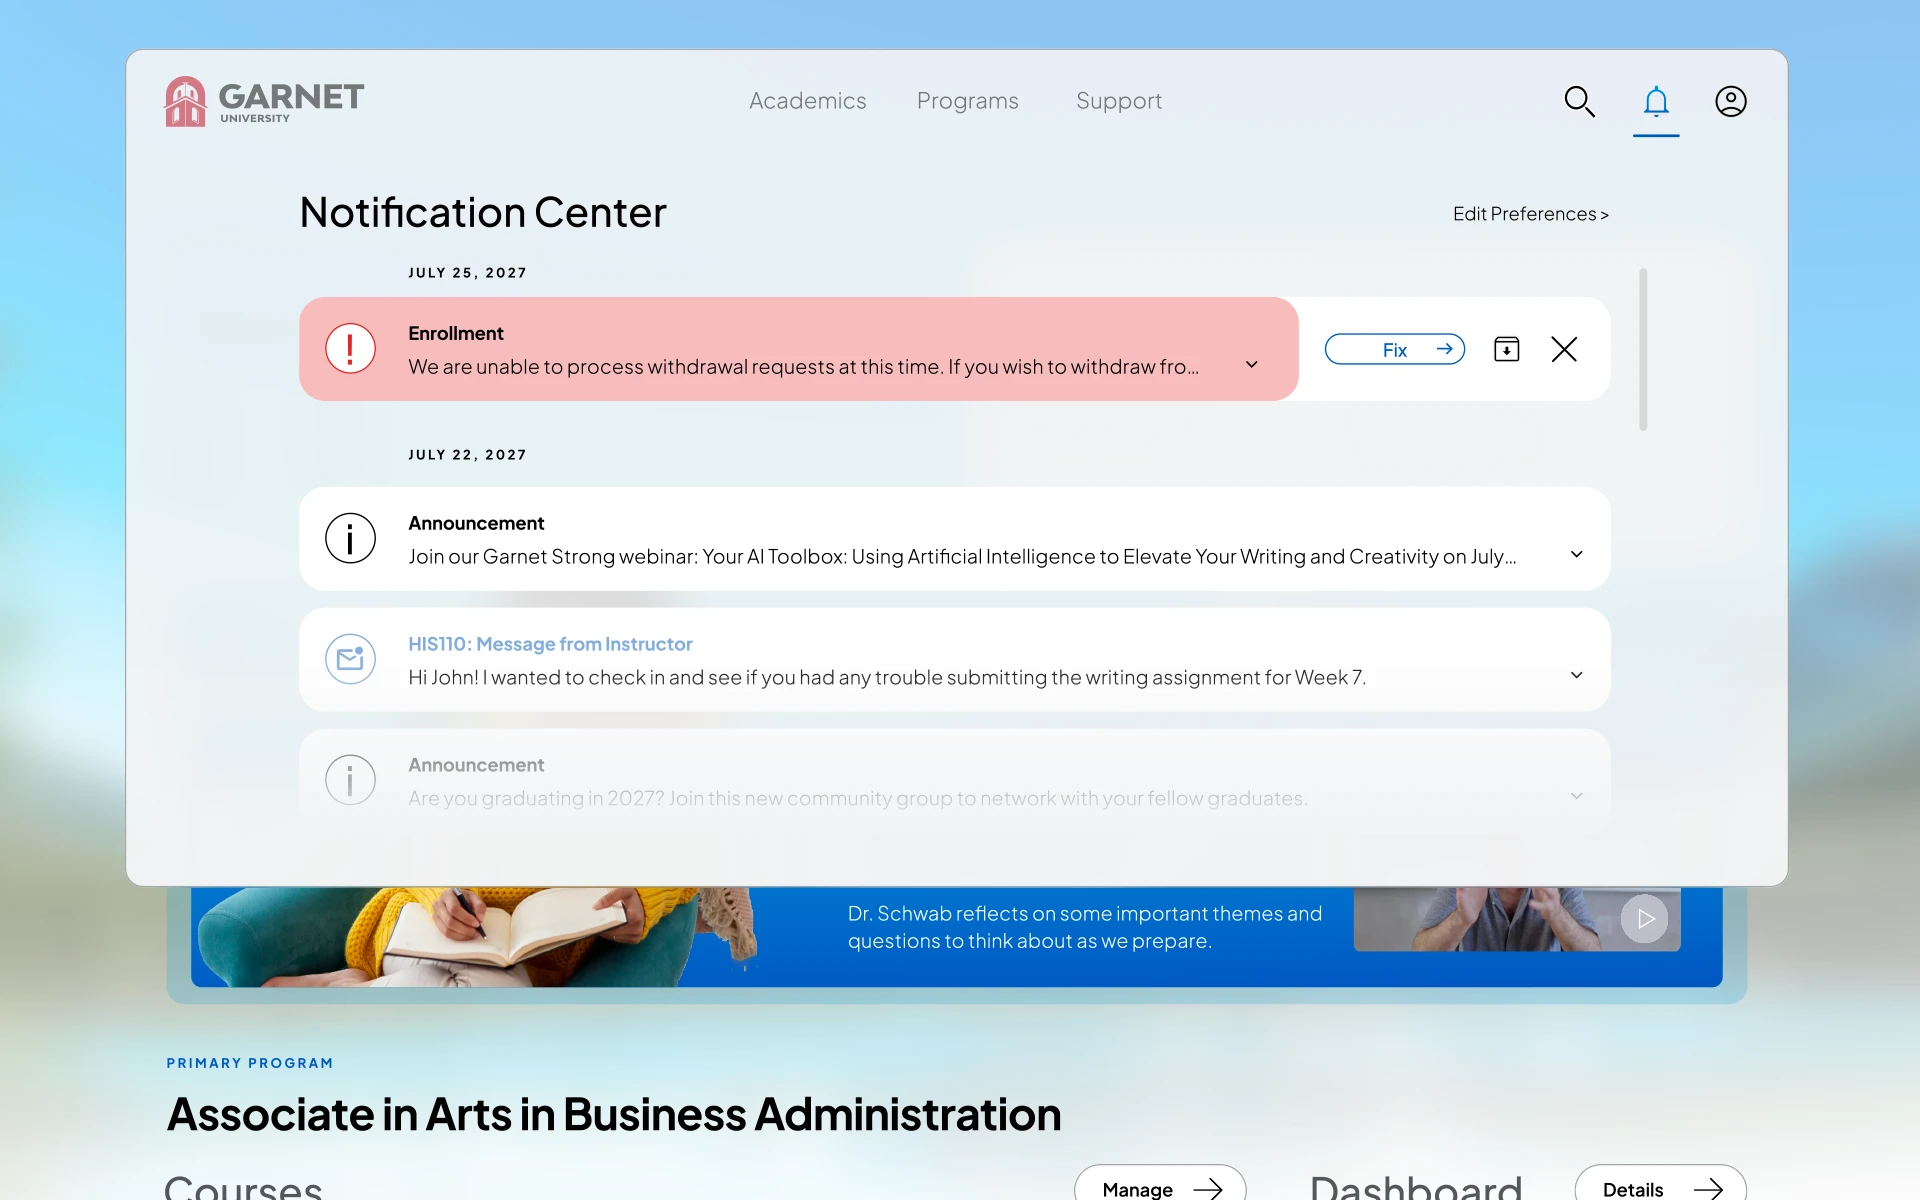
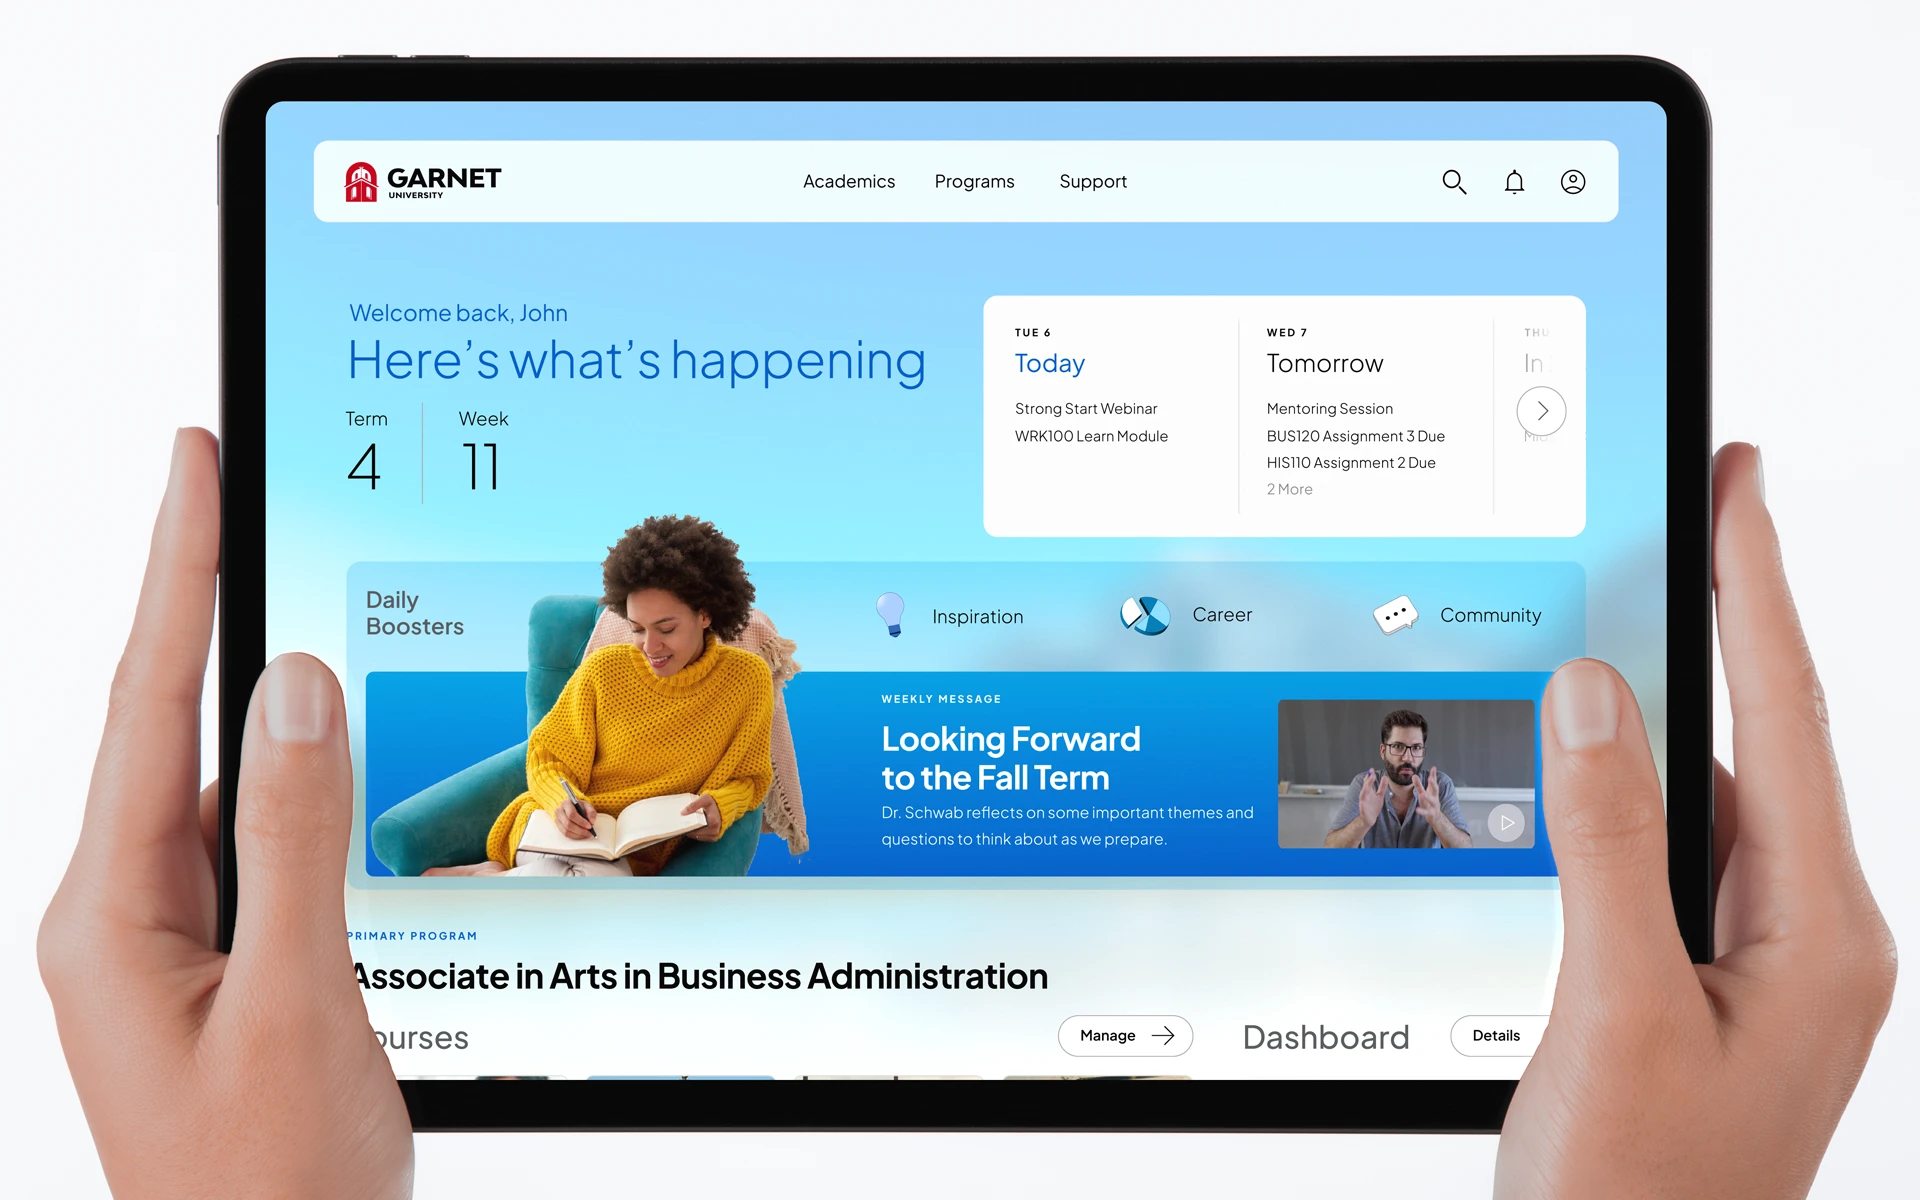
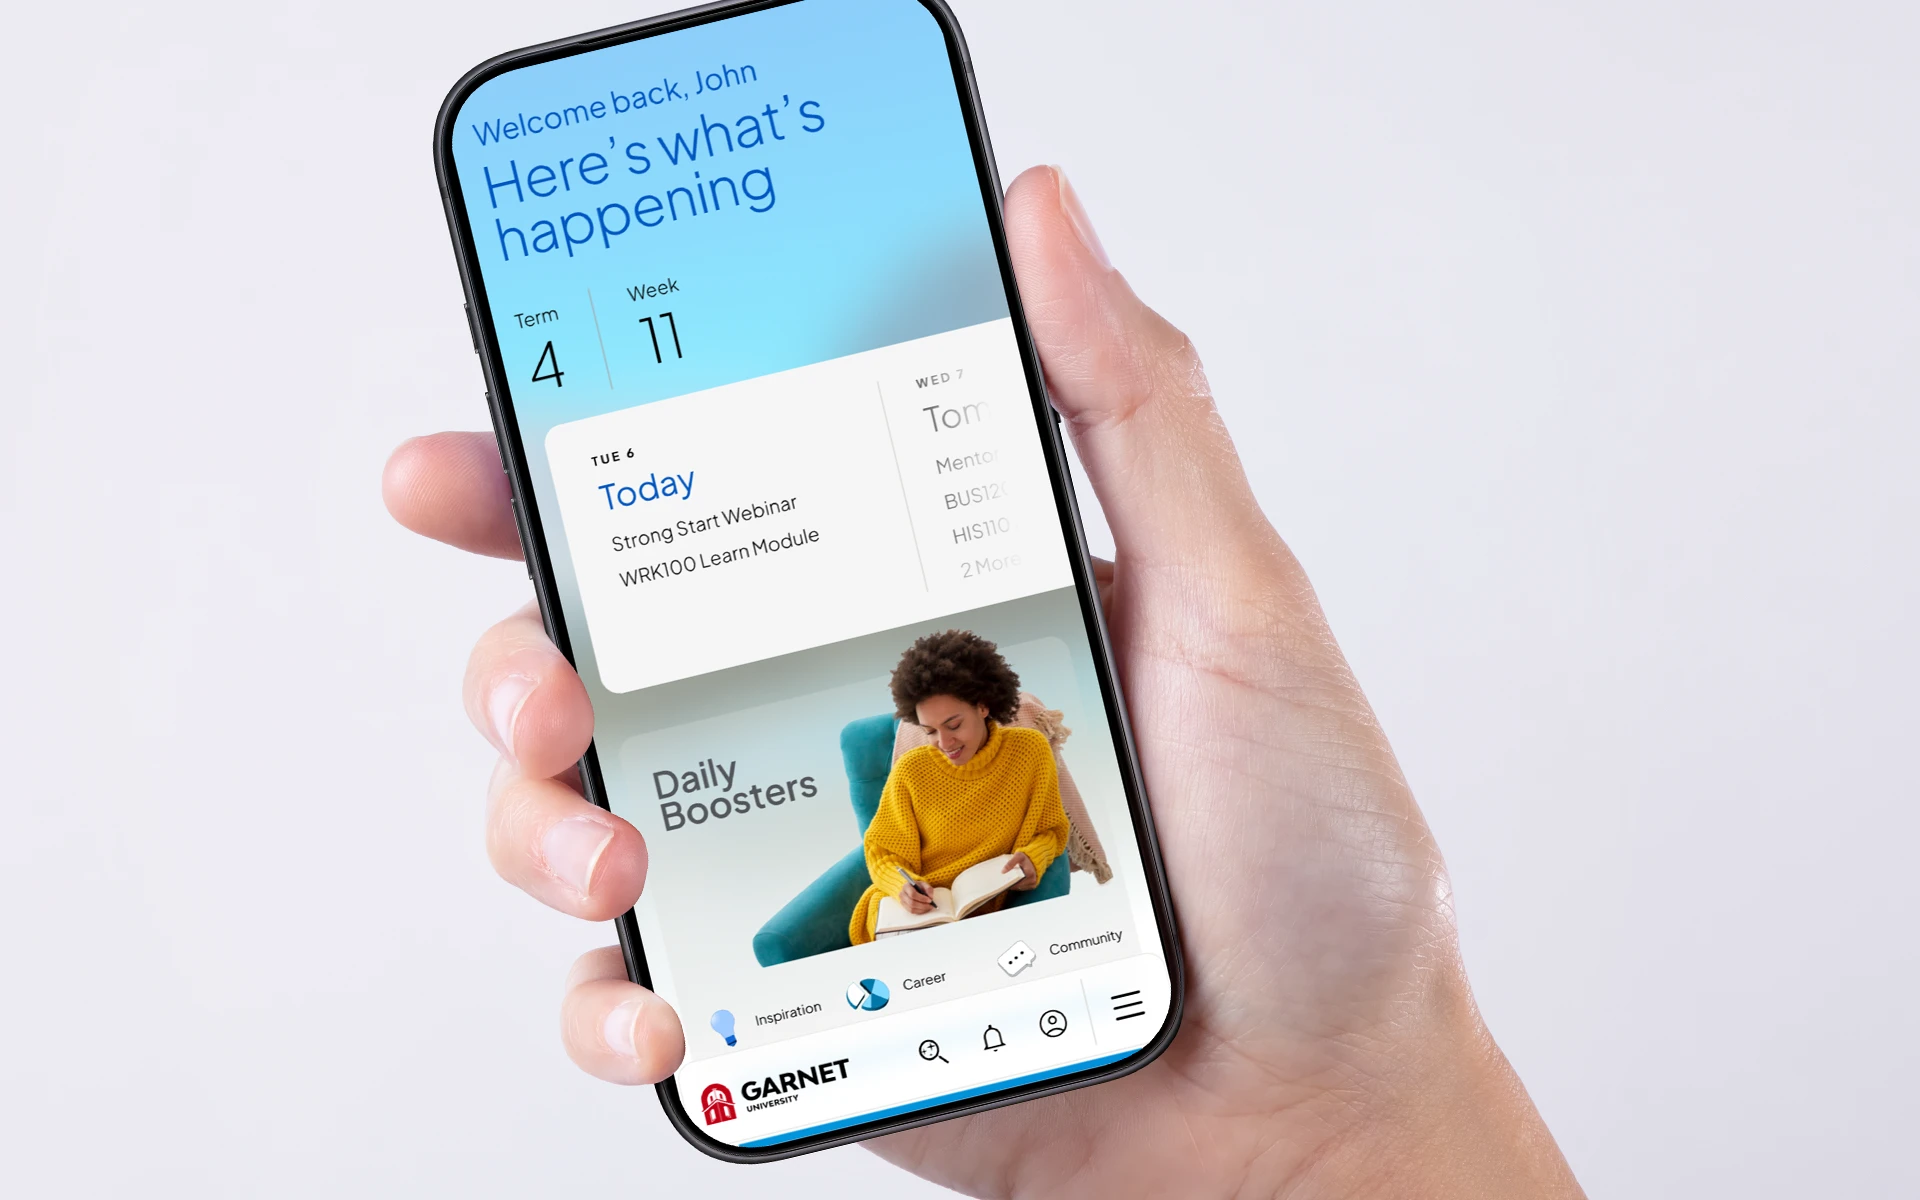
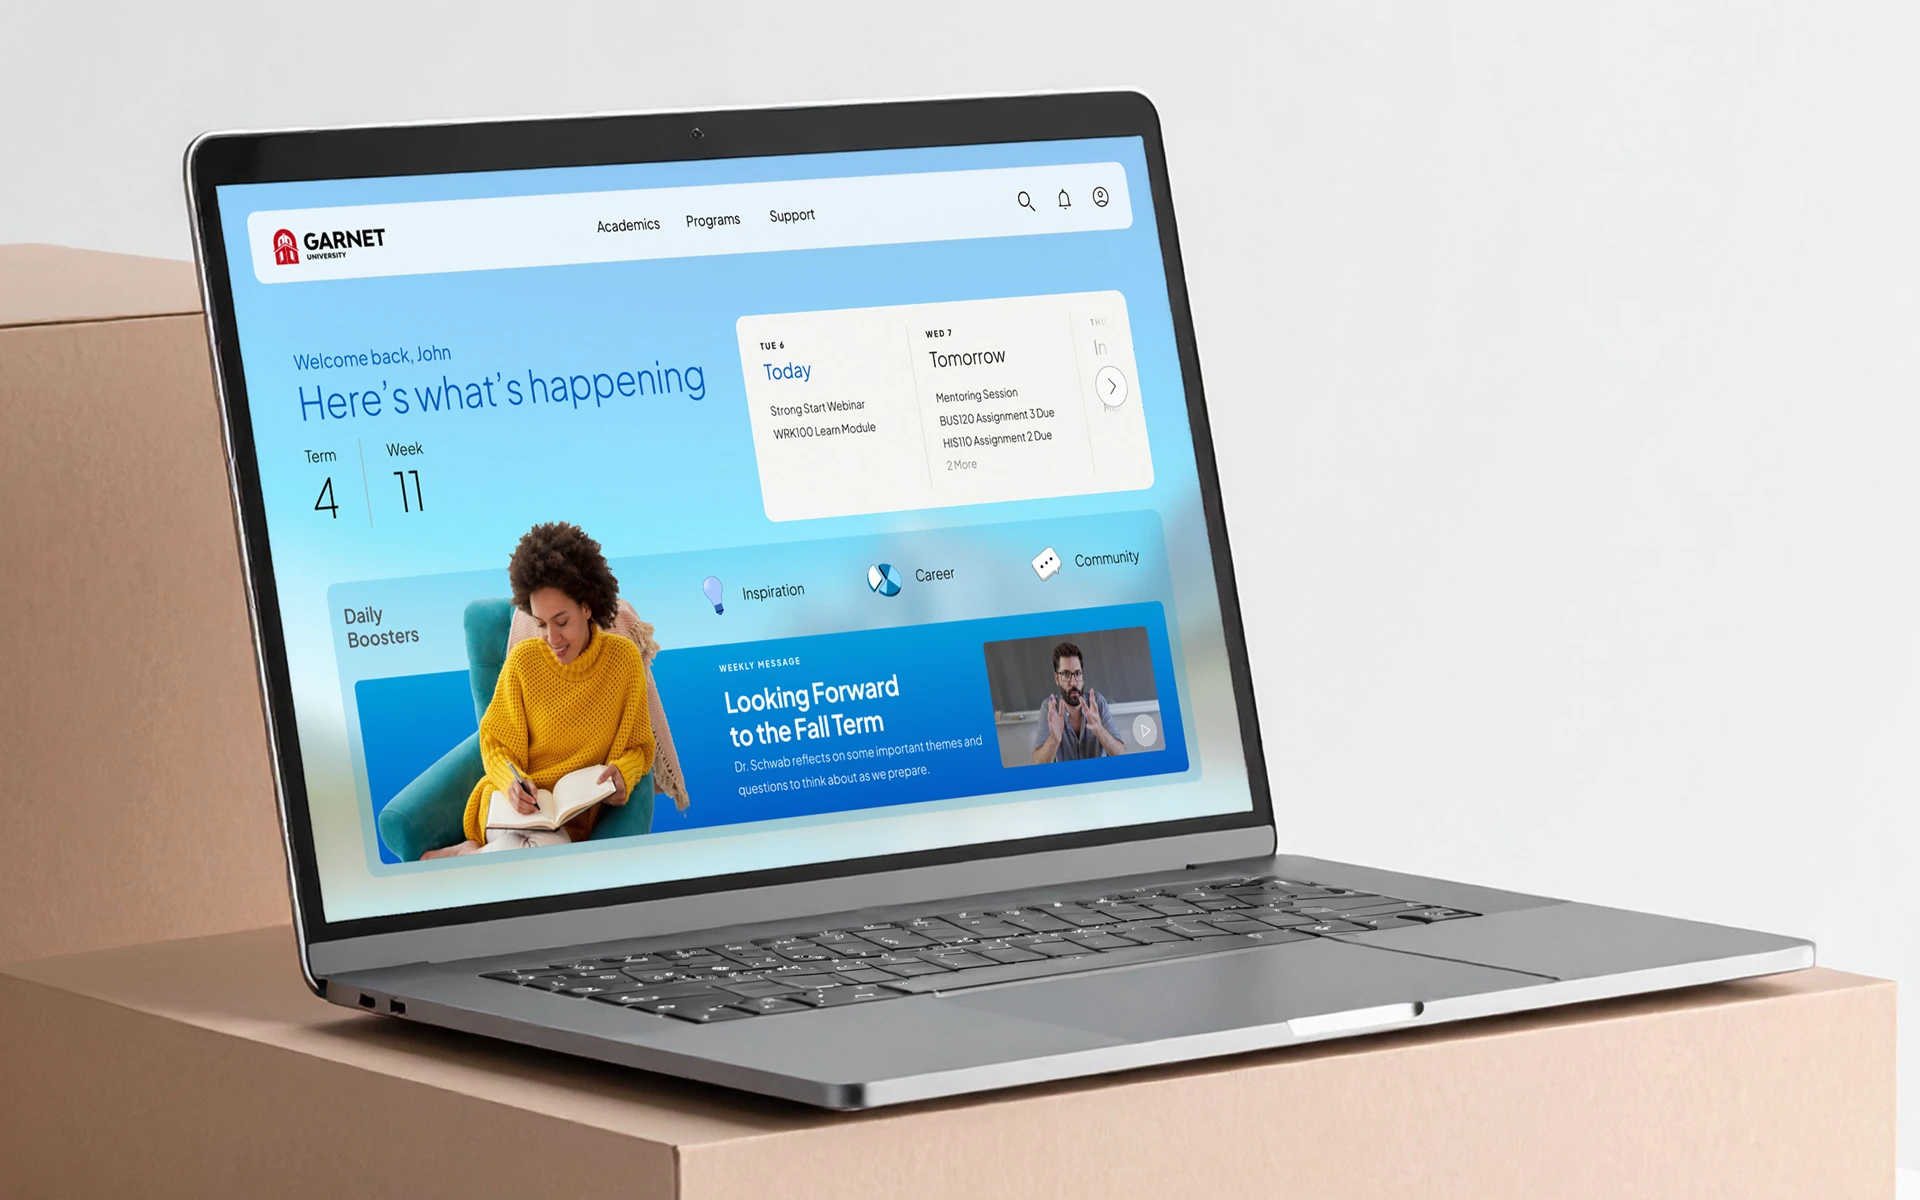


Core Initiatives
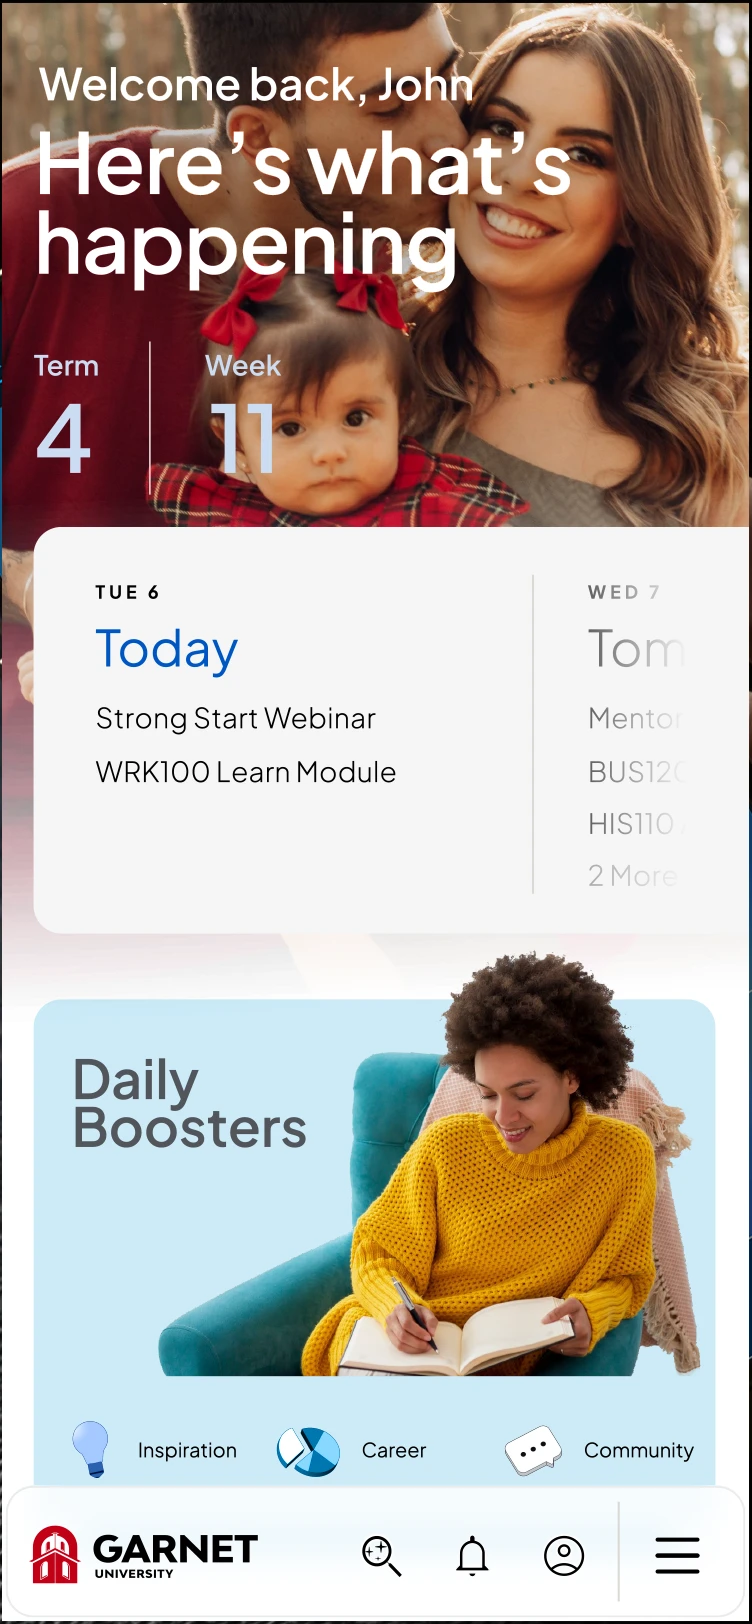
Simplicity

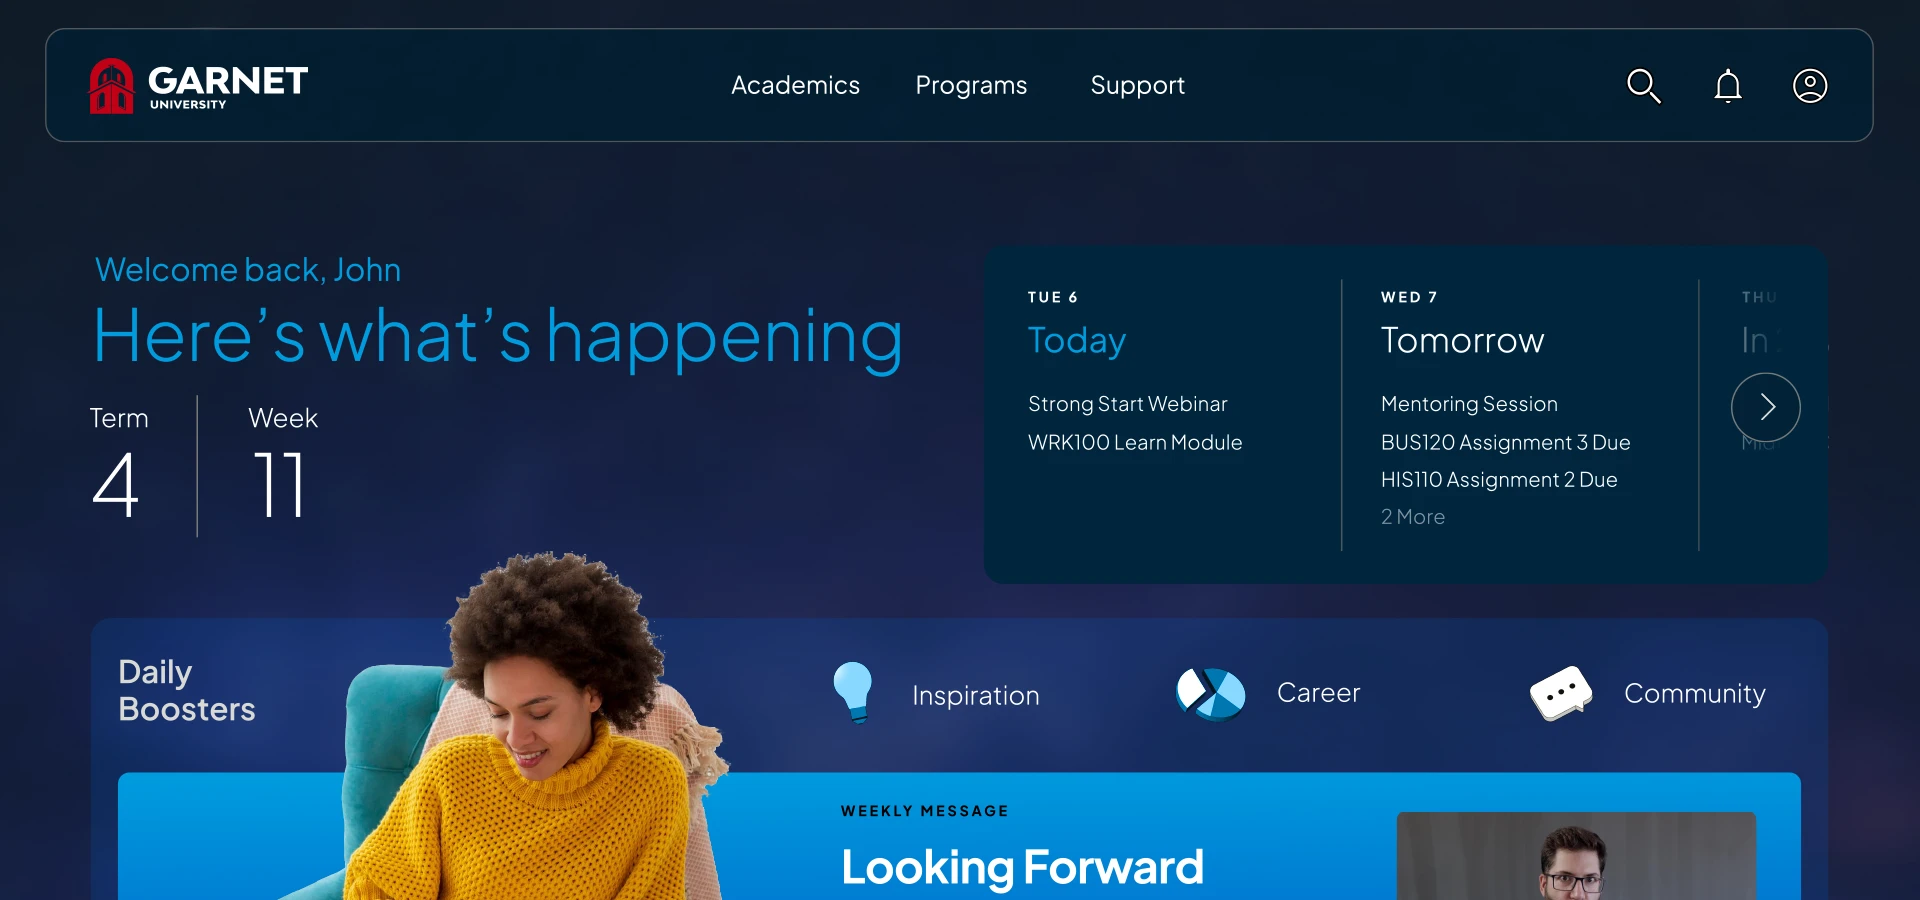
Contextual Content
There when you need it, hidden when you don’t
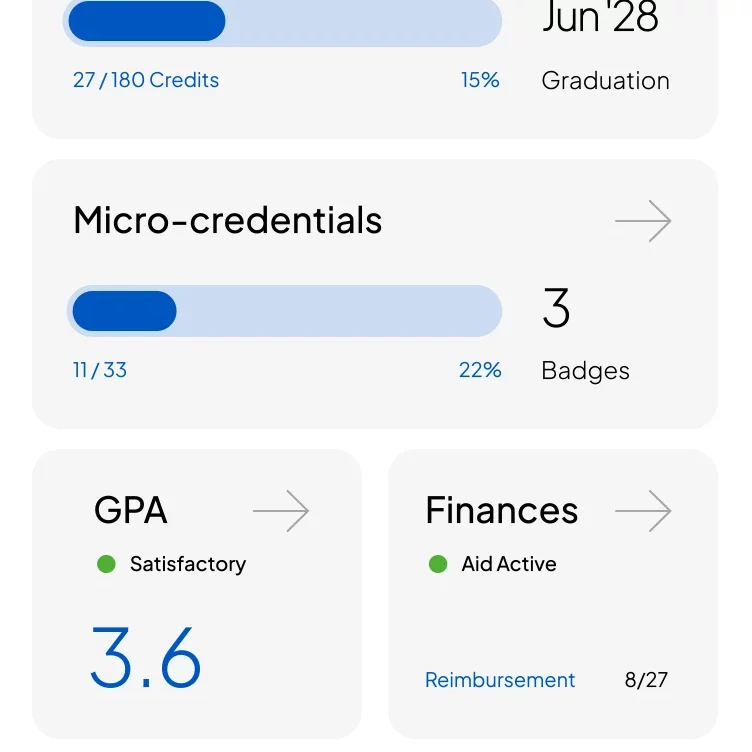
Drill Down
Start with a macro view and add detail only if wanted
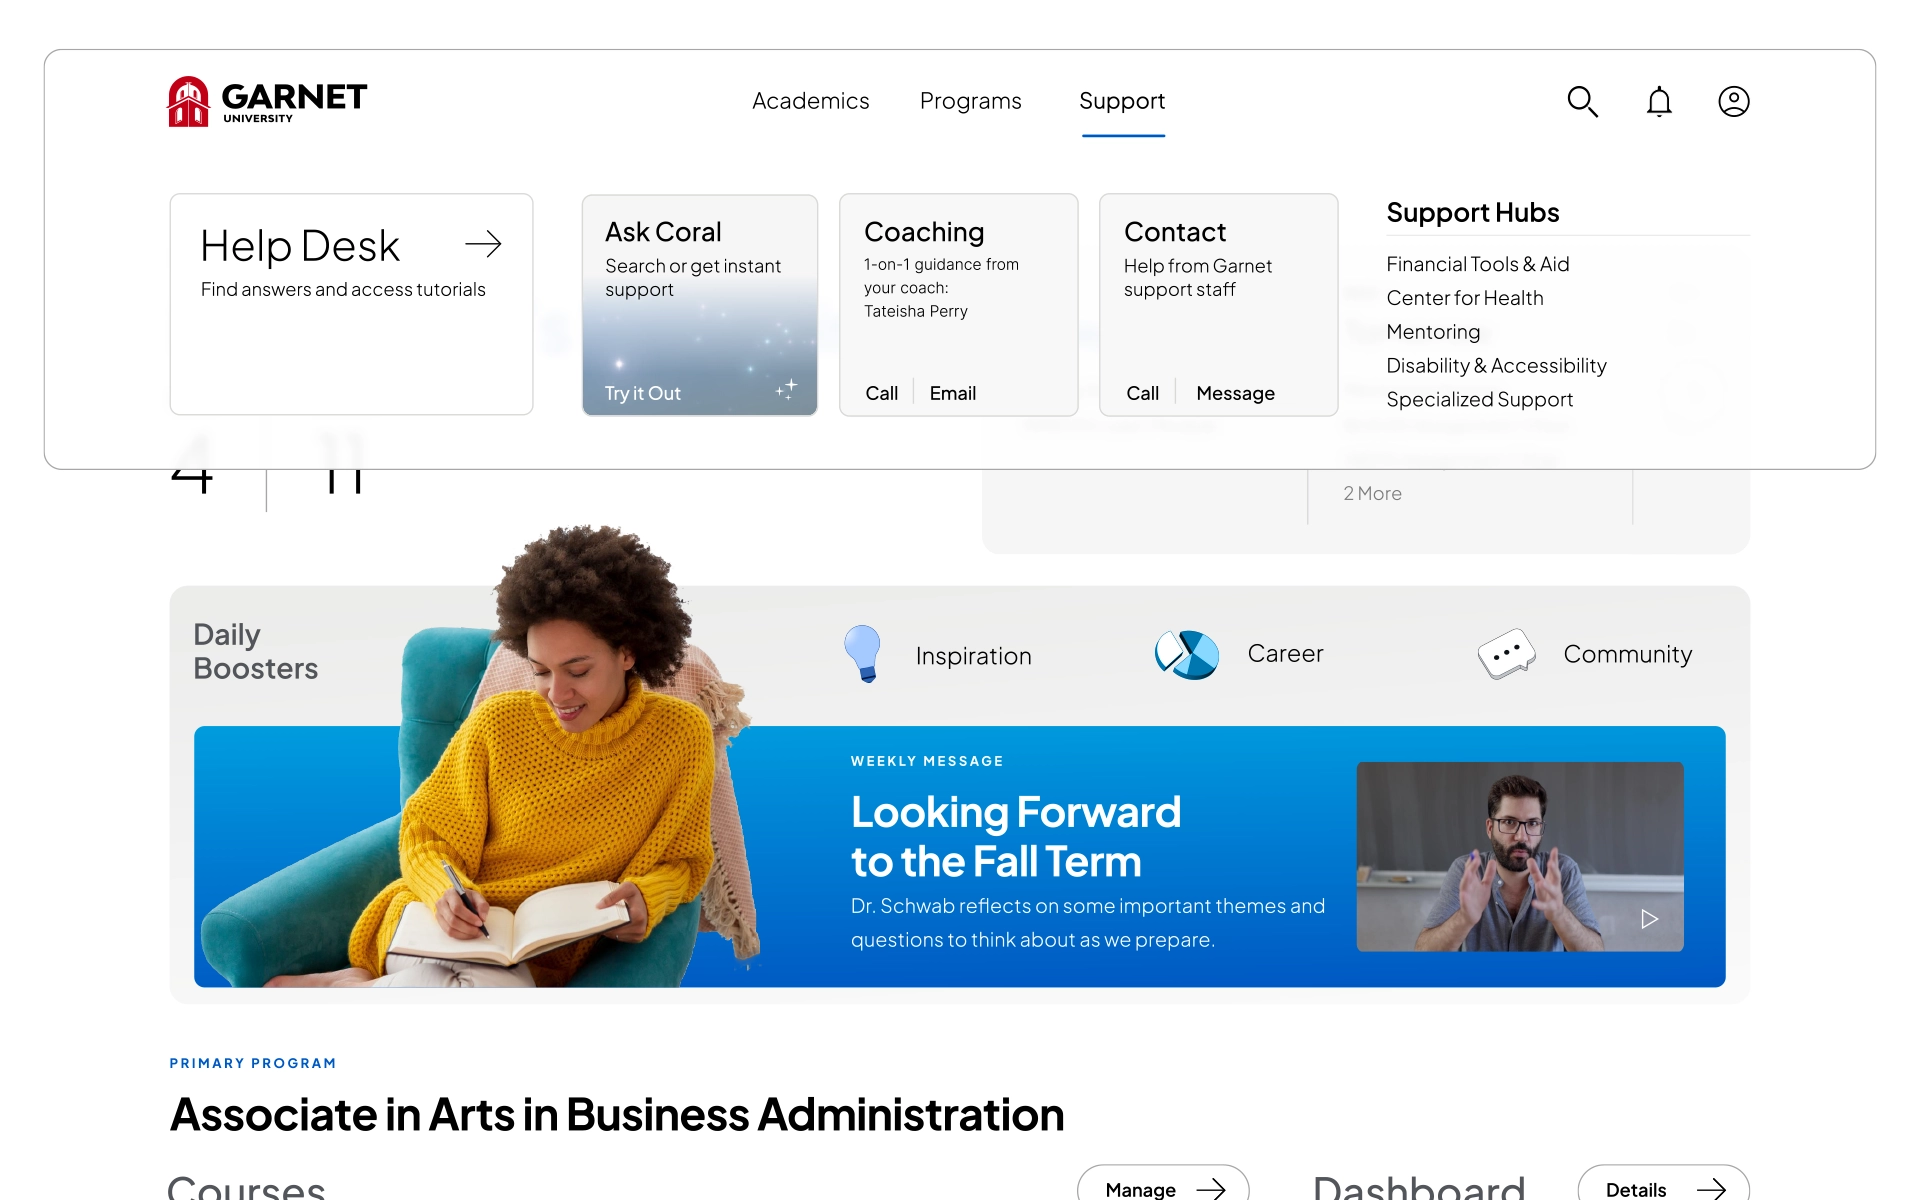
Support
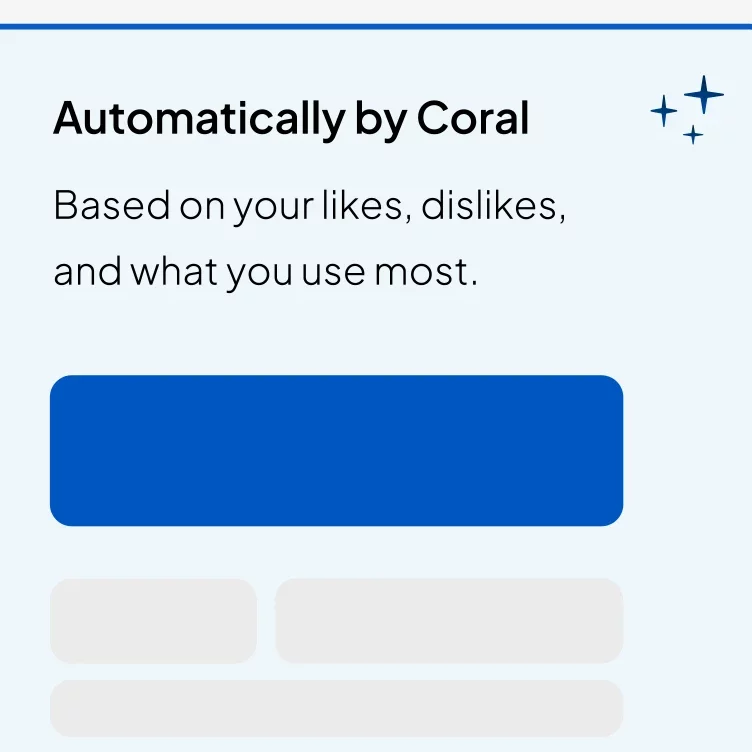
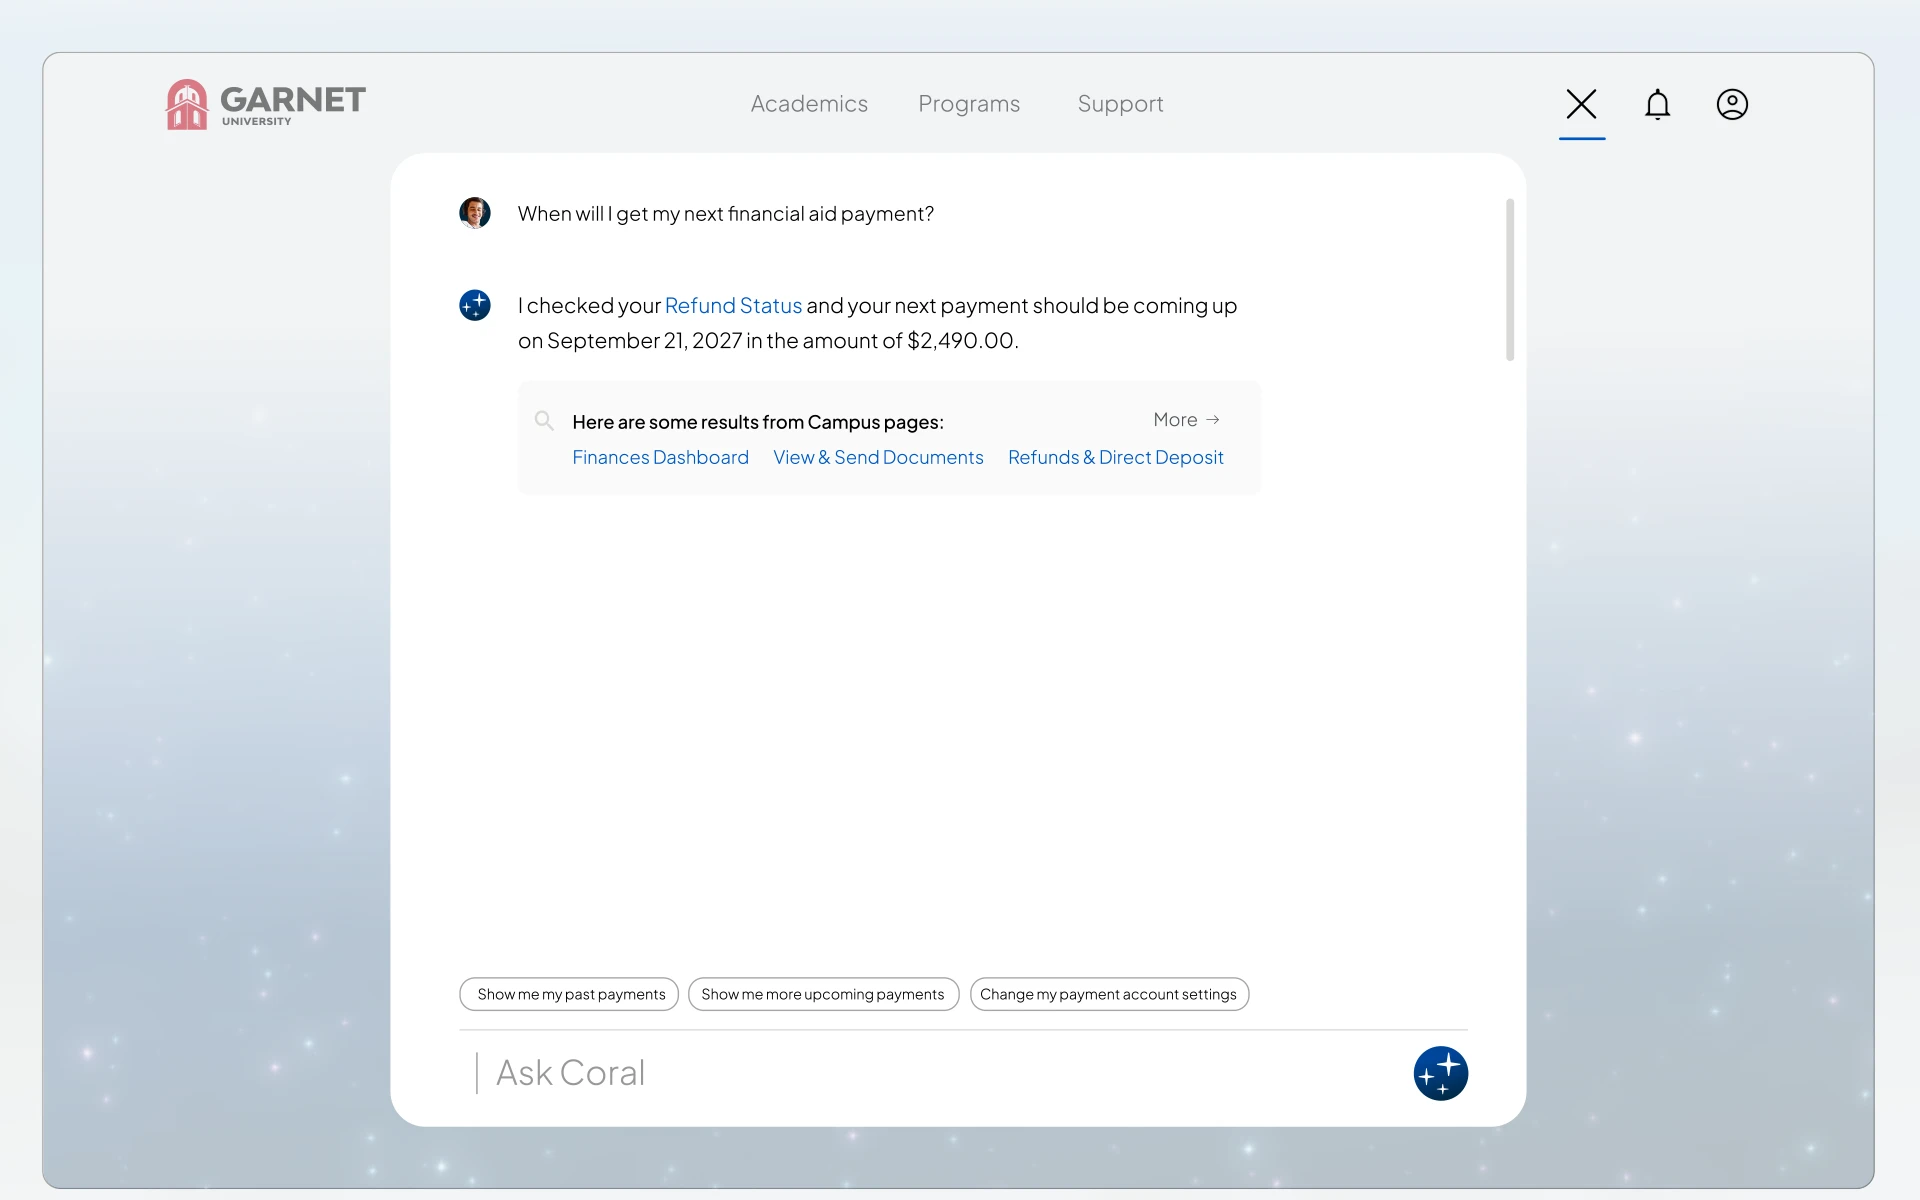
Intuitive AI
Keep visits exciting with new, relevant, customized content
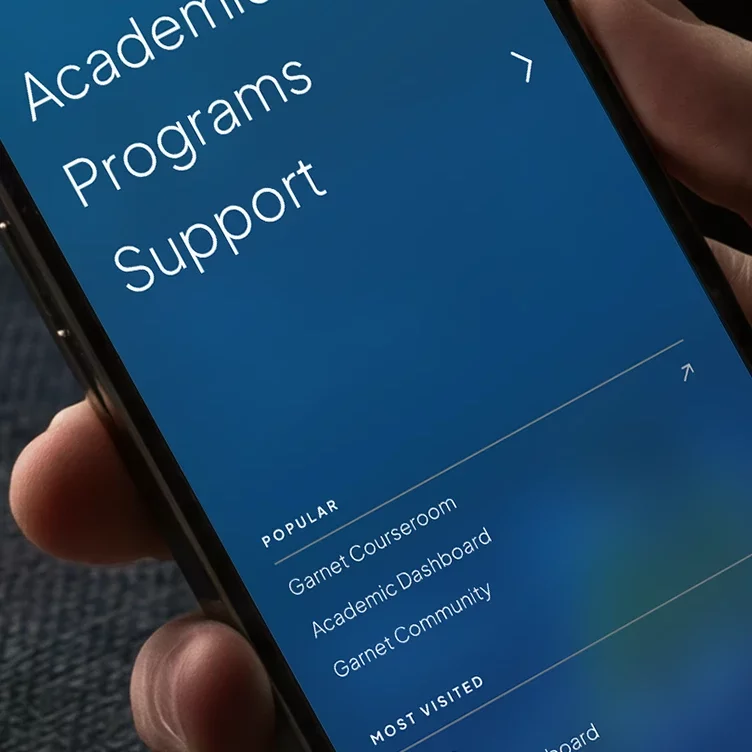
Access Anywhere
Ensure broad device support and seamless transitioning
User-centric

Students First
Present based on user needs, not business initiatives

Automation Before Customization
Predict a “want” and give it before having to be asked
Design Principles
Consistency
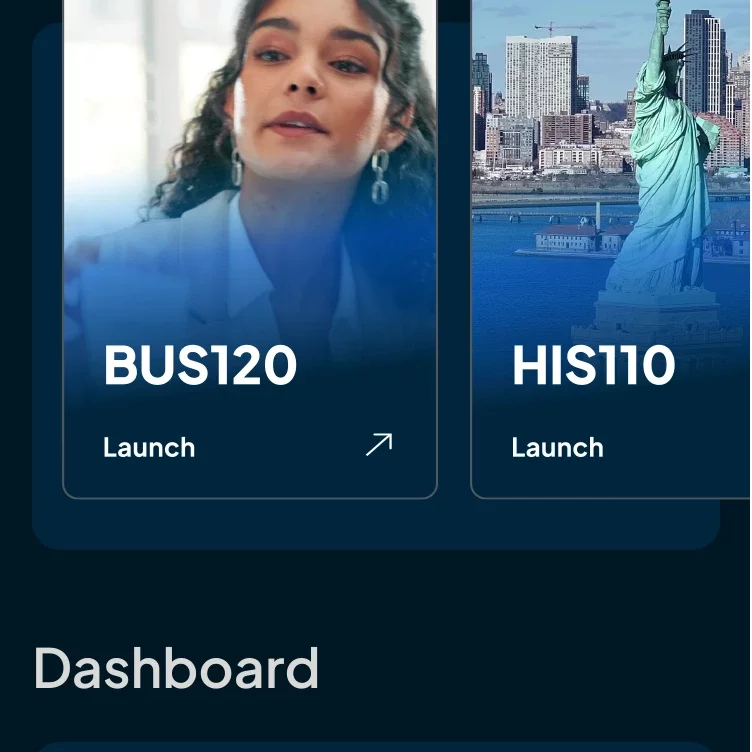
Centralize
Bring in maximum outside resources and content
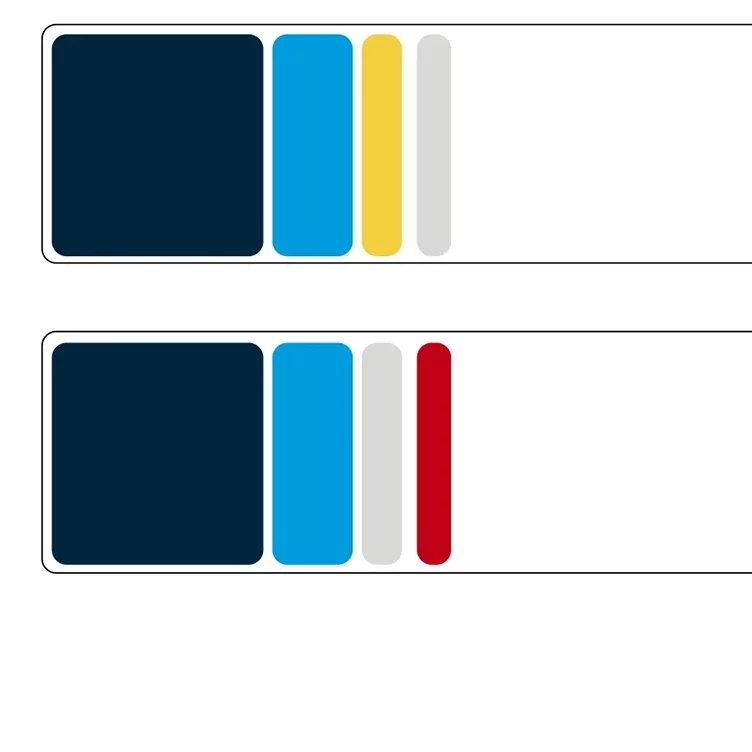
Brand Alignment
Ensure guideline adherence and uniformity of elements across platforms
Balance
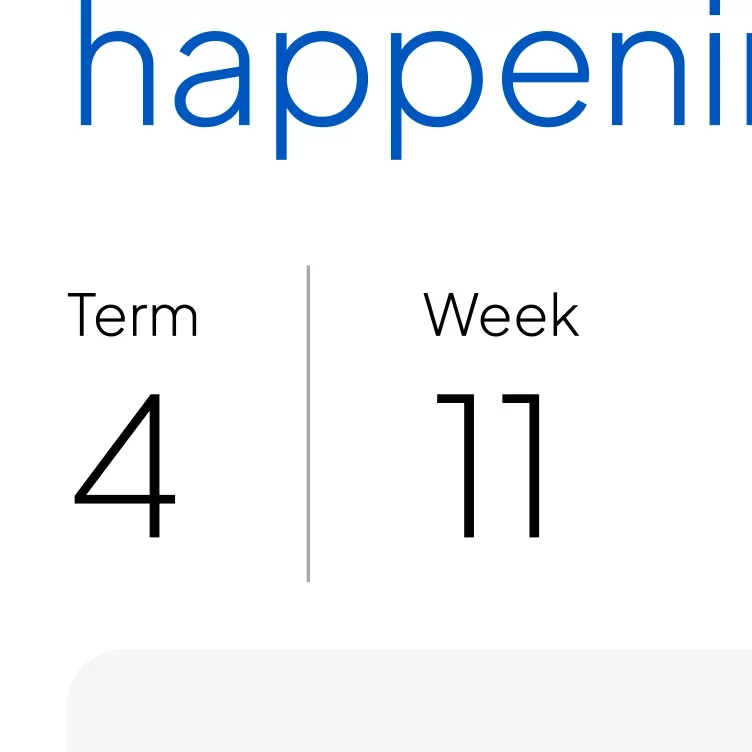
Take a Breather
Integrate ample white space in margins and text to avoid visual overload

Have Some Fun
Intersperse utilities with dynamic content to avoid information overload
Details
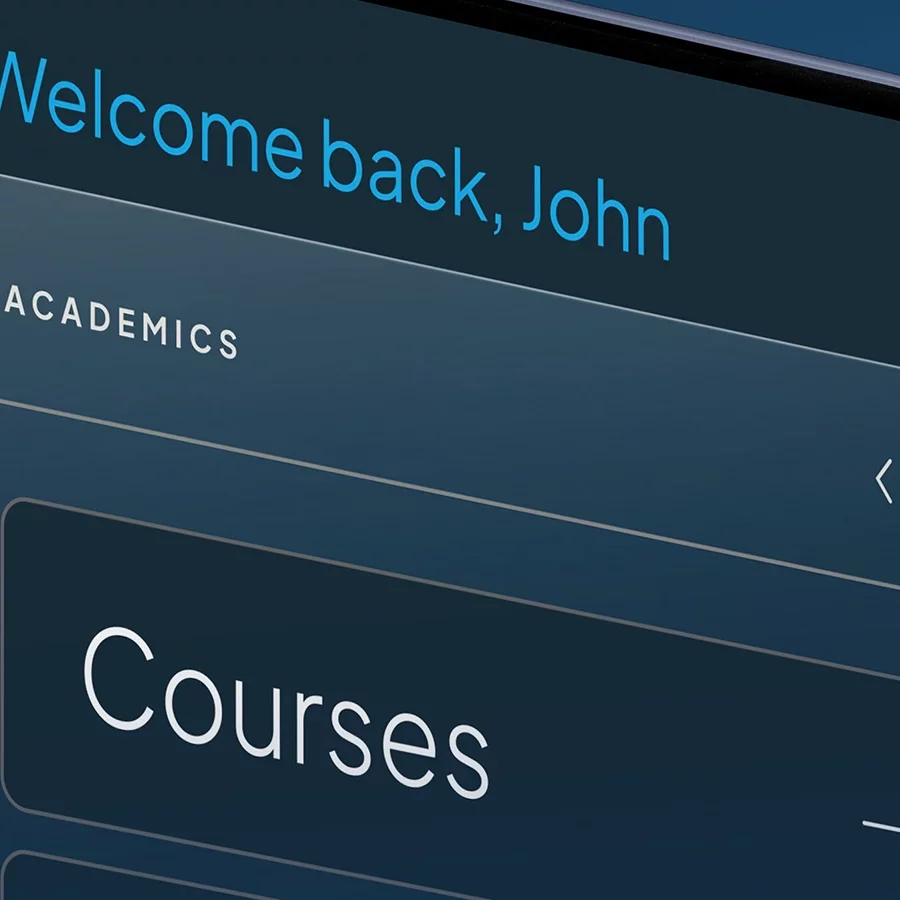
Create Delight
Add microinteractions and unexpected animations
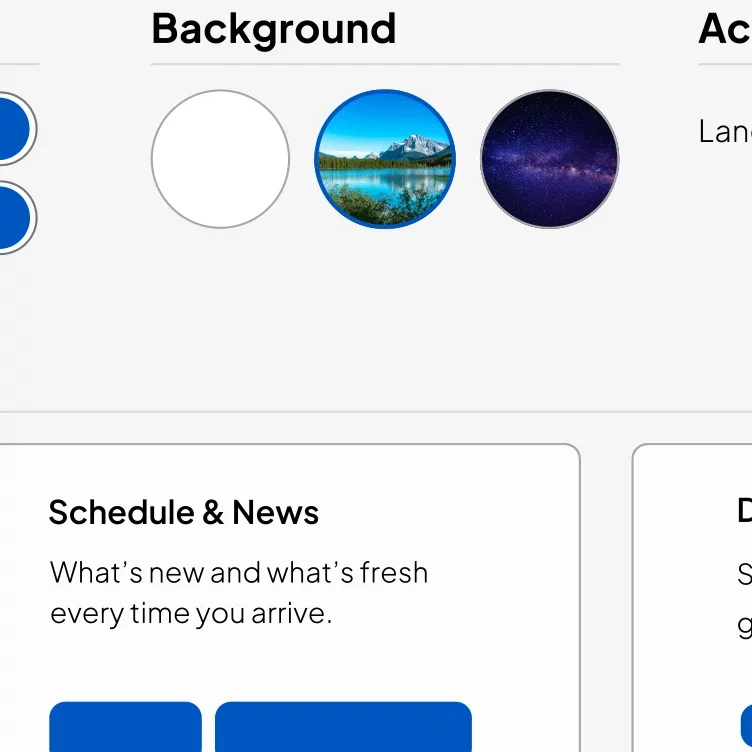
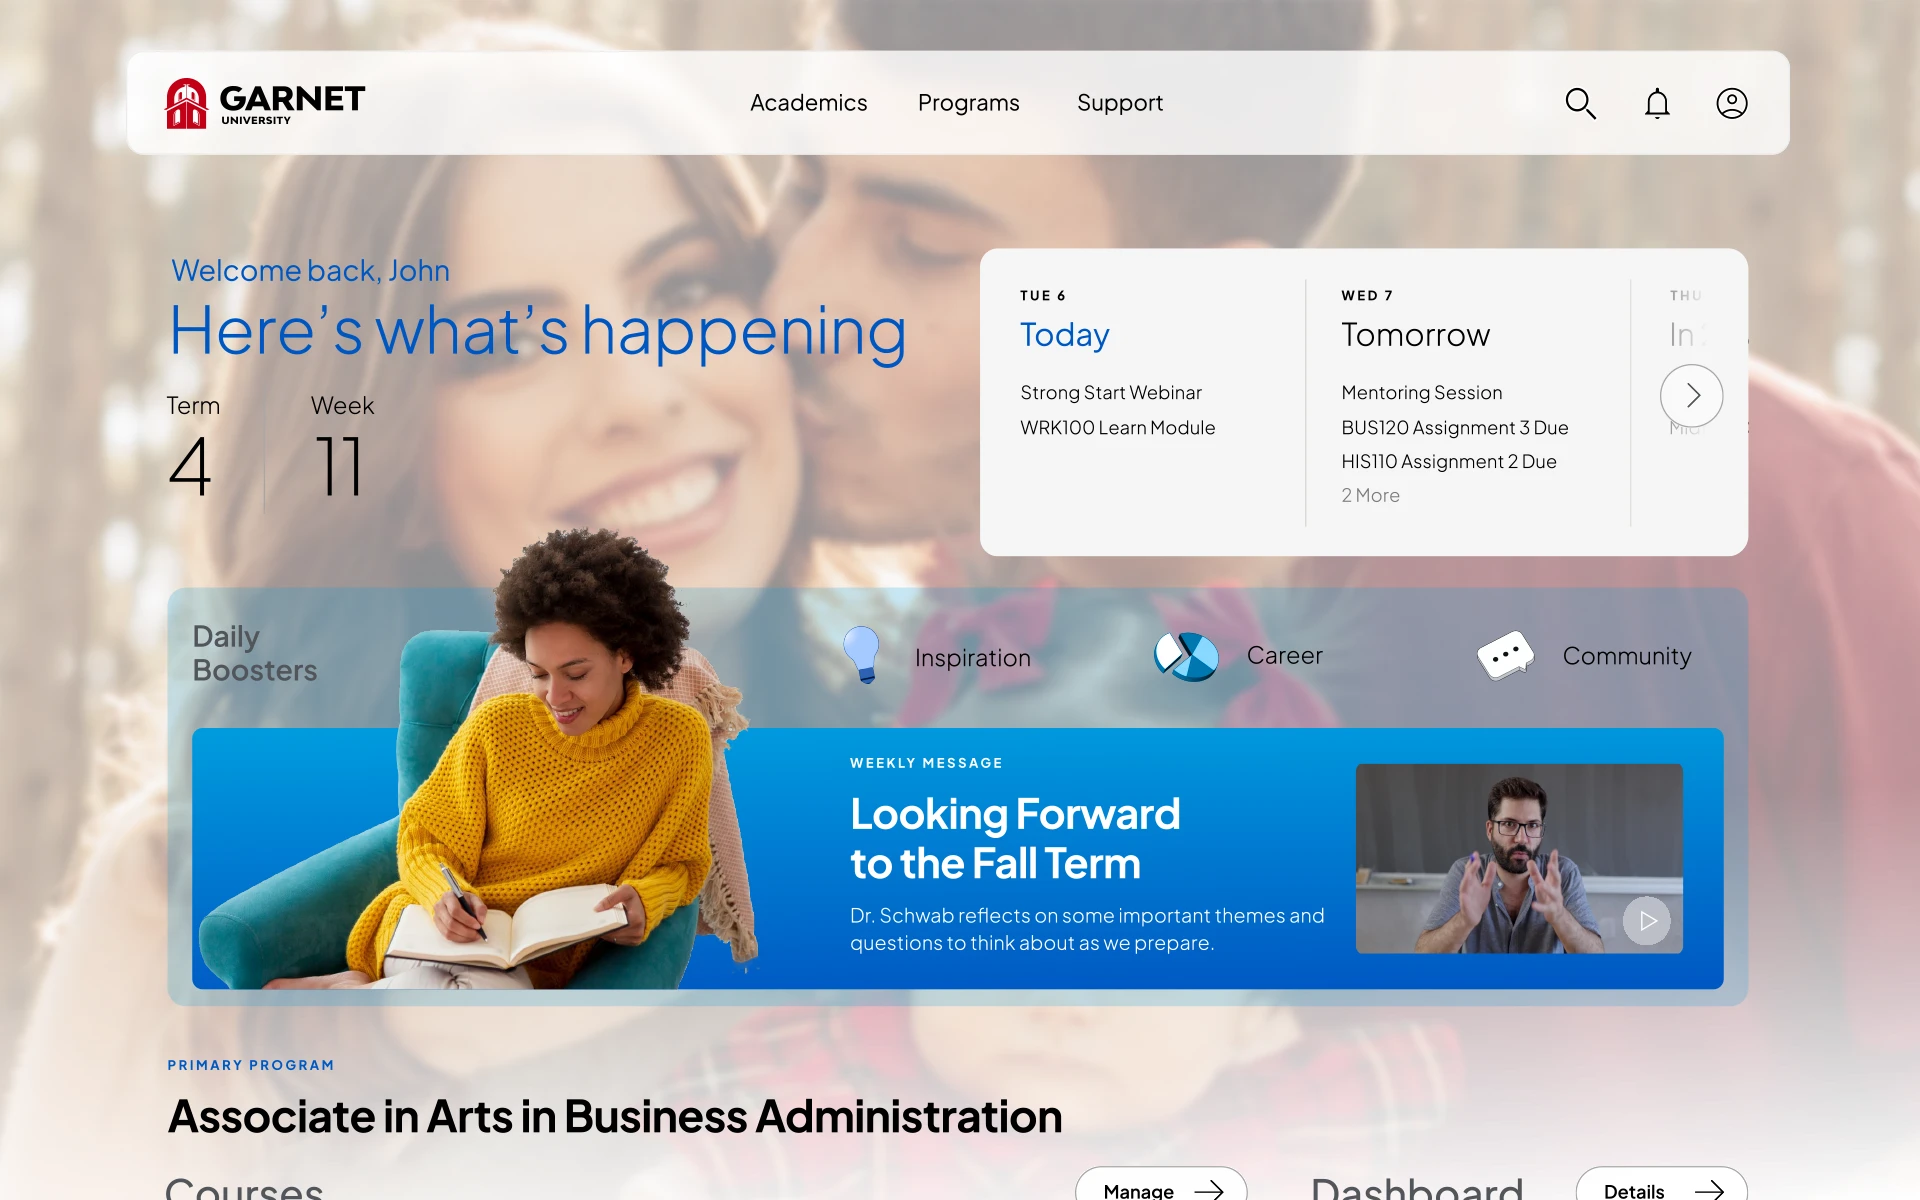
Make myCampus Yours
Allow customization: modes, personalized imagery, and content reordering
Results
89%
Satisfied orVery Satisfied
Student satisfaction with the portal via a post-launch survey rose from 66% to 89% “satisfied or very satisfied,” based on criteria like usefulness, information quality, and interface quality.
42%
Faster toComplete Tasks
Average time to complete core tasks like accessing classes, paying tuition, or checking grades decreased by more than 3 minutes on average, based on before/after task-completion studies.
31%
Increase inMobile Use
Mobile usage share increased from 34% to 65%, indicating that more students trusted the portal on phones and tablets after the responsive redesign.
54%
Decrease inIT Support Tickets
Support tickets related to portal questions declined by 100s in the month following implementation of a range of self-support from DIY to AI-assisted, alongside automatic error correction guidance.